Anthropic Subscribers Can Track Claude Code Across Machines
The independent Claude Observability project combines local usage records into a self-hosted dashboard without uploading prompts, responses, code, or Anthropic credentials.
Listen
AI narration
11:35
0:00 / 11:35
AI SummaryGenerated from this article
Claude Observability, an independent MIT-licensed project, lets Claude Pro and Max subscribers track usage across multiple machines through a self-hosted dashboard without uploading prompts, code, or credentials to Anthropic. The tool aggregates local session files from each machine into a unified workspace, displaying model consumption, limit pressure, and API-equivalent costs while deduplicating requests across devices.
The collector requires Node.js 20 and PostgreSQL 15, running locally before enrolling machines. While it avoids uploading sensitive conversation content, metadata like session titles, timestamps, and project names are transmitted by default. Usage estimates rely on undocumented transcript formats and learned limit ceilings, missing roughly 5-10% of activity from side requests and cloud sessions.
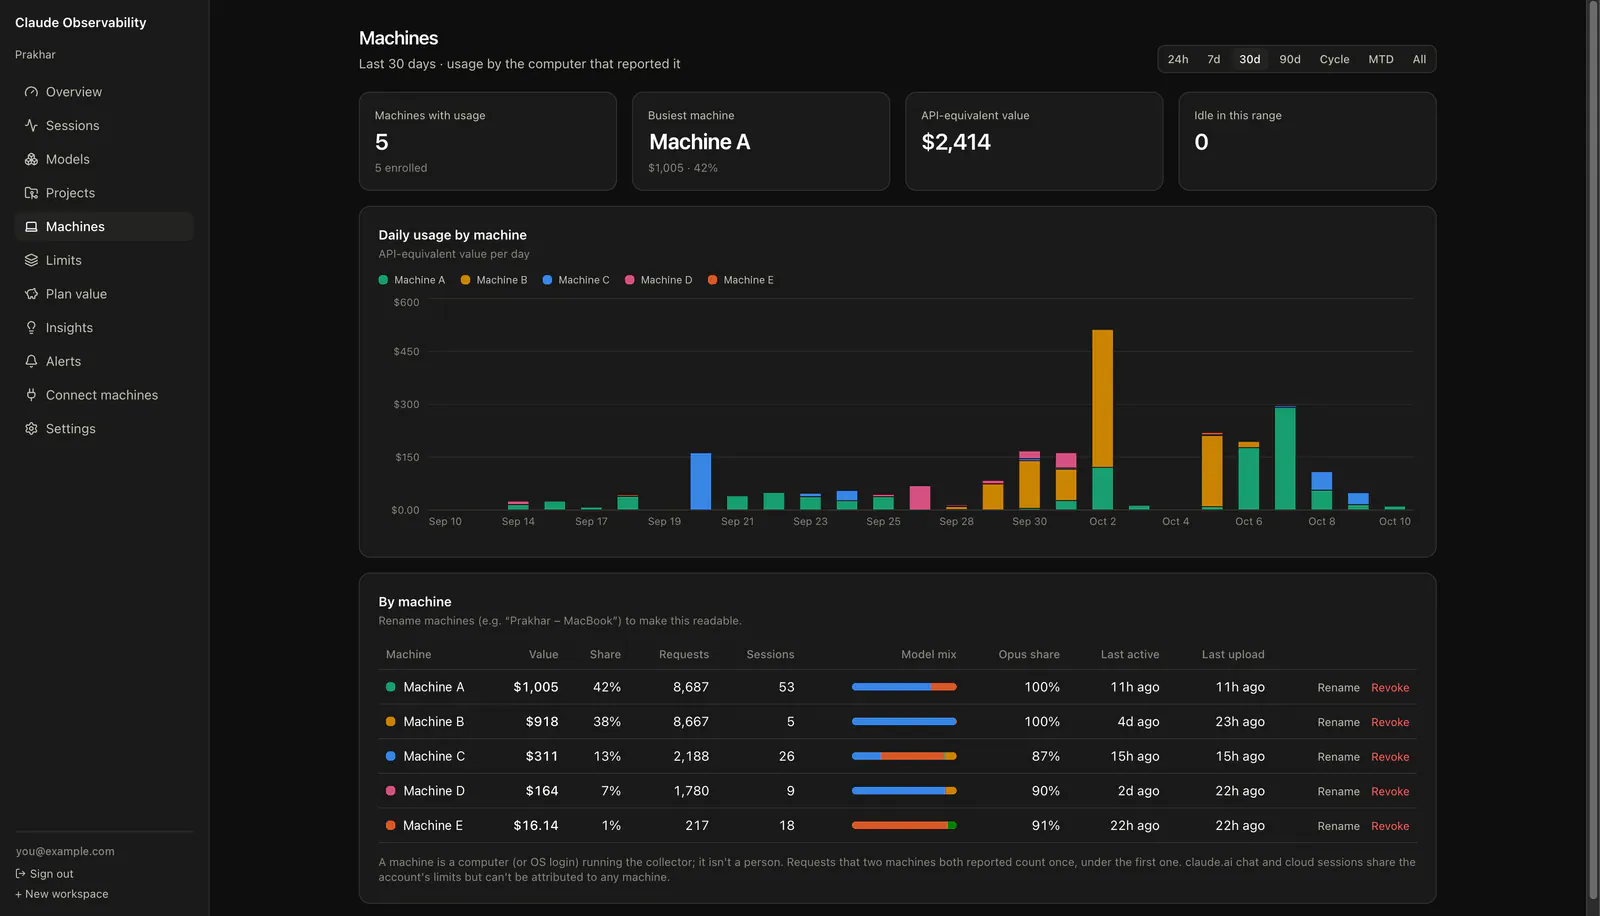
Claude Code activity on a laptop, desktop, and remote development machine can feed a single account-level usage dashboard. Claude Observability, an independent MIT-licensed project, builds that view from local session files instead of pulling billing records from Anthropic.
The project targets Claude Pro and Max subscribers who want to know which sessions and models consume their allowance, how close they came to a limit yesterday, and what their usage would have cost through the API. A Node collector runs on each machine, and a self-hosted Next.js application combines the uploads.
Anthropic already provides some of this information. Its usage guidance documents progress bars for both five-hour and weekly limits, so the reporting gap is narrower than the project’s pitch suggests. Claude Observability adds historical session accounting, model mix, project breakdowns, and aggregation across connected machines.
It remains an installable analytics tool, not an official subscription meter. The dollar figures are comparisons, and the limit forecasts are estimates.
One Account Becomes the Unit of Measurement
Claude Observability organizes connected machines into a workspace representing one Claude account. Each collector pushes new usage records to that workspace, where the server merges requests and calculates API-equivalent value using a bundled price book.
The dashboard exposes several useful views:
Sessions and projects: Request counts, duration, models, subagent activity, compactions, and estimated value.
Model mix: Token consumption, cache activity, and how much of the account’s API-equivalent value comes from each model.
Limit pressure: Five-hour blocks, consumption rate, projections, and previous blocks that reached a limit.
Subscription value: API-equivalent consumption compared with the configured plan price and billing cycle.
Reporting health: Which machines have uploaded recently and whether data coverage looks incomplete.
Optional alerts can report an approaching learned limit, unusually high consumption, or a machine that stops reporting.
For developers moving between local and remote environments, a laptop-only report could look comfortably below a limit while another machine consumes the same account’s allowance. Cross-machine collection brings that activity into view.
Work with Zeniteq
Let’s work together
We’re open to thoughtful collaborations with teams building in AI. Explore the ways we can work together.
Requests reported by multiple machines are deduplicated. Copying or resynchronizing a transcript should not make the same request appear twice in account totals. Machine-level activity remains visible, but the project deliberately avoids a per-person leaderboard.
The environment file needs the database connection, authentication secret, application URL, and cron secret described in the README. After configuring those values, create the database tables and start the development application:
npm run db:migrate -w @claude-obs/web
npm run dev
The local dashboard runs at http://localhost:3100. Sign in, create a workspace for the Claude account, and generate an enrollment code under Connect machines.
For cross-machine use, the dashboard needs an address reachable from those machines. A laptop’s localhost address will not connect a remote development server to that laptop. The repository also documents deployment to Vercel.
On each computer running Claude Code, install the collector and inspect its output before enrolling:
The dry run prints what would be uploaded and sends nothing. Once satisfied with the payload, replace the server placeholder below with the deployed dashboard address:
The first sync uploads the usage history available in local session files. The background agent keeps subsequent activity current.
Before uploading, the collector writes batches to a local outbox. According to the project’s design, an offline machine retains its queue for a later retry, so it does not need a continuous connection.
Usage-Only Does Not Mean Metadata-Free
The collector reads Claude Code session files, which contain sensitive conversation material. Its privacy boundary concerns what it extracts and transmits; the files themselves contain more than harmless counters.
The project says it never uploads prompts, responses, thinking text, code, file contents, tool inputs or outputs, full paths, email addresses, or Claude credentials. It reads the Claude account identifier to calculate a salted hash but does not read OAuth tokens or the keychain.
Uploads still contain potentially revealing metadata: request and session identifiers, timestamps, model names, token counts, project-folder basenames or salted hashes, Git branches, and skill or plugin names. Session titles are uploaded by default, although users can disable them:
claude-obs config titles off
A title or branch name can disclose a customer, internal feature, or incident even when the conversation stays local. Self-hosting gives the operator control over the destination; it does not make every metadata field nonsensitive.
In his technical write-up, developer Prakhar Gurunani describes three safeguards: field-by-field output construction, tests that plant sensitive marker strings and check they never appear in serialized uploads, and the inspectable dry-run payload.
These safeguards are more concrete than a broad privacy promise, though they remain the project’s documented measures, not evidence of an independent security audit. Developers handling sensitive work should inspect the actual payload and secure the dashboard like any other service holding operational data.
Repeated Transcript Lines Are Not Extra Requests
Reconstructing usage requires more than summing every token count in a transcript.
Gurunani reports that Claude Code can write separate lines for multiple content blocks in one response while repeating the response’s usage object. In his sample, 3,301 assistant lines represented 1,889 distinct requests. Naively adding every line overcounted usage by about 75%.
Streaming adds another complication: the output-token count can increase between records belonging to the same request.
Claude Observability groups records by request ID and retains the largest output count instead of adding those repeated values. The server applies the same maximum-value rule, preventing a delayed upload from replacing a newer, larger count with an older one. Request-level deduplication also covers resyncs and overlapping data sources.
The reported validation is encouraging but limited. Gurunani says the collector produced $235.18 in API-equivalent value against $235.27 from a separate comparison script, with the difference explained by one request made while both were running. This is an author-reported consistency check, not a third-party benchmark.
According to the project, Claude Code’s transcript format is internal and undocumented. The parser handles an allowlist of known records and exposes counts of unknown records through its data-quality view. Those counts help surface format changes, so users should check the warnings instead of assuming compatibility indefinitely.
API-Equivalent Value Is Not Subscription Spending
Every dollar figure in the dashboard represents what the recorded tokens would cost at Anthropic’s pay-as-you-go API prices. It is not an additional bill and does not measure how much money a subscription user actually spent.
The comparison can answer a useful question: does the developer’s recorded usage exceed the subscription price on an API-rate basis? It can also reveal an expensive session or heavy use of a model that deserves closer examination.
A high value multiple cannot establish that every token delivered equivalent business value, that a cheaper model would have completed the same task, or that the subscriber would have purchased identical usage through the API. It measures consumption, not return on investment.
The price book introduces another dependency. The README dates its bundled API prices to October 8, 2026. Unknown models remain counted but unpriced until pricing is added. Missing prices can therefore reduce the reported value even when request collection works correctly.
For subscription decisions, the dashboard is strongest when consumption value is considered alongside actual limit pressure and whether the work required those models.
Limit Forecasts Still Have Blind Spots
Claude Observability models five-hour windows without receiving an authoritative remaining allowance from Anthropic. Its documented approach starts a block at the first request after the previous block expires, rounded down to the hour, and estimates a ceiling from the median API-equivalent value observed at actual limit hits.
That learned ceiling needs at least one recorded hit. It provides an empirical reference for the account, not a published token allowance or a guarantee about when Anthropic will stop accepting requests.
Anthropic’s guidance says model choice, conversation length, tool use, effort level, and caching all affect consumption. A dollar-denominated approximation should not be treated as a fixed conversion into remaining subscription capacity.
Coverage is incomplete too. The project estimates that local transcripts miss roughly 5–10% of usage because side requests, such as title generation and classifiers, do not appear there. Optional OpenTelemetry collection can add those requests and latency information:
claude-obs otel --install
Both sources are merged by request ID. Claude web chat and cloud Claude Code sessions, however, remain invisible to the local collector despite sharing subscription limits. The dashboard flags limit hits with little tracked usage as a possible coverage problem.
Anthropic’s own usage display reports the allowance state; Claude Observability helps explain the recorded work behind it. For developers using several machines, that explanation can support better model choices and subscription decisions, provided missing activity is treated as missing data rather than unused capacity.