Google DeepMind and its partners have released Forest Typology (ForTy) 2020, a global AI map that distinguishes natural forests from planted forests, intensive timber plantations and tree-crop farms. The October 22, 2026 announcement also introduces an early annual series covering 2017 through 2025, allowing users to examine changes between those categories.
The project brings together Google DeepMind, Google Research, the World Resources Institute (WRI) and the International Institute for Applied Systems Analysis (IIASA). Each mapped cell measures 10 by 10 meters, according to DeepMind’s announcement.
The practical advance is the distinction between trees being present and natural forest being preserved. An oil palm estate and a rainforest can both look green from space. For conservation and commodity sourcing, confusing them can hide a consequential change in land use.
ForTy provides evidence for investigating those changes. It is not, on its own, a certificate that a farm, supplier or shipment meets EU deforestation rules.
Six Classes Reveal What Tree Cover Conceals
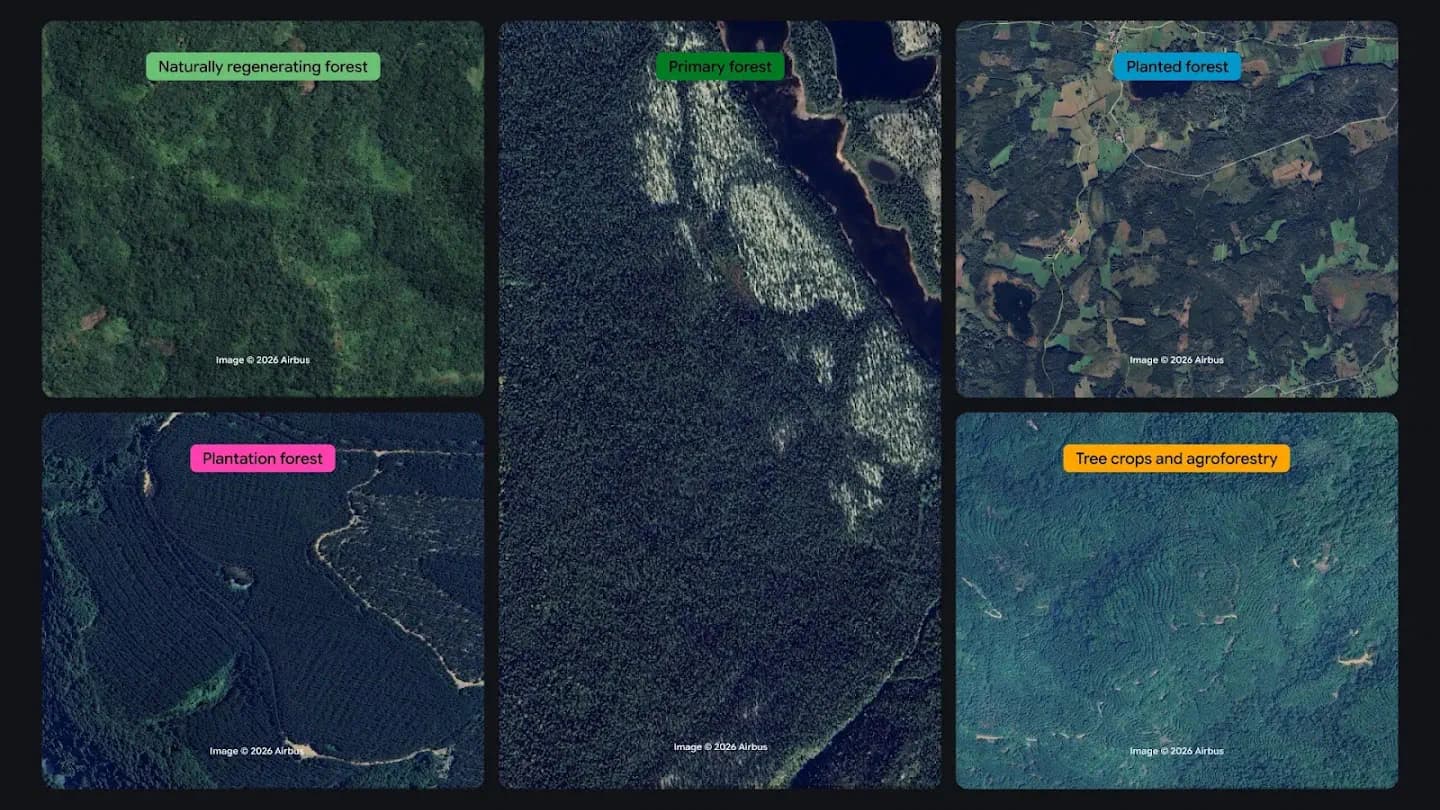
ForTy assigns land to six categories based on definitions from the UN Food and Agriculture Organization. DeepMind describes the classes as follows:
| Class | What it describes |
|---|---|
| Primary forest | Native forest with no visible signs of human disturbance |
| Naturally regenerating forest | Forest that grew back on its own, including after logging or fire |
| Planted forest | Forest established by planting or seeding and managed over long cycles |
| Plantation forest | Fast-growing, intensively managed tree farms, often containing one species |
| Tree crops and agroforestry | Farms growing products other than wood, such as oil palm, rubber, cocoa or fruit |
| Other land | Remaining areas, including grassland, cropland, cities and water |
The separation between planted forest and plantation forest deserves attention. Both can involve deliberate planting, but the announcement distinguishes their management patterns: long-cycle planted forests versus fast-growing, intensive plantations. Treating every planted tree stand as the same category would lose that distinction.
Tree crops and agroforestry sit in a separate class because trees can be part of agricultural production. A canopy map may continue to show substantial tree cover after natural forest becomes a tree-crop farm. A forest-type map aims to reveal that conversion.
My view is that this taxonomy is the release’s most useful feature. Higher-resolution greenery alone cannot answer a land-use question. Naming the type of tree-covered landscape makes the map more relevant to conservation priorities and supply-chain checks.
The categories still need careful interpretation. “Primary forest,” for example, refers here to native forest with no visible signs of disturbance. That wording matters when the classification comes from remote observations.
How Satellite Histories Help Infer Forest Management
ForTy uses approximately 1.7 million labeled locations, drawn from expert surveys, national and regional datasets, and targeted reviews of places where the model struggled. Its inputs include AlphaEarth Foundations embeddings, which DeepMind describes as compact summaries of years of satellite observations for each 10-meter pixel.
Embeddings give the model a way to use information gathered across time. According to the announcement, relevant clues include planting patterns, growth cycles and harvest rhythms. Those signals can help distinguish landscapes that look similar in a single image.
An intensively managed stand may have a different growth and harvest pattern from naturally regenerating forest. Regular planting arrangements can also offer clues about how people use the land. The model’s task is to infer a category from such evidence, including features beyond canopy color.
A 10-by-10-meter cell covers 100 square meters, or 0.01 hectares. That is detailed enough to examine variation within many production plots, but a pixel is not a surveyed property boundary. As a practical matter, cells along forest edges or narrow agricultural strips may contain more than one kind of cover.
For screening work, I would keep the supplier’s actual plot boundary separate from the map grid. The grid describes predicted land classes; the boundary identifies the production area that needs checking.
The Annual Series Adds a Conversion Timeline
The release contains two related products: the 2020 baseline map and an early annual series from 2017 to 2025. The baseline describes forest types in a reference year. The series lets users examine how classifications change over time.
Consider a hypothetical plot classified as naturally regenerating forest in 2020 and tree crops in 2023. That transition would be a reason to investigate possible conversion to agriculture. A simple comparison of tree presence could miss the significance if the later crop also forms a canopy.
Different users can apply that history in different ways:
- Conservation teams can prioritize places where natural forest appears to become plantation forest, tree crops or other land.
- Commodity companies can compare sourcing plots with the 2020 baseline and examine subsequent classifications for potentially relevant changes.
- Regulators can use mapped transitions to help identify locations that merit closer investigation alongside submitted due-diligence information.
These are possible workflows derived from the documented outputs, not reported deployments.
The time series also introduces a separate reliability question. A change between annual labels could reflect a real transition, classification error or ambiguity in one of the years. The supplied announcement does not provide separate validation results for annual change detection.
An annual map also cannot, by itself, date a clearing to a particular day. That distinction matters when checking activity against a legal cutoff. And because this released series ends in 2025, it provides historical coverage, not a live view of conditions at the October 2026 announcement.
Probabilities Matter More Than a Single Colored Label
DeepMind reports that ForTy was validated against more than 9,000 randomly selected sites worldwide. At each site, two trained experts examined high-resolution imagery and years of satellite records to determine the land type.
The team reports:
| Validation task | Reported accuracy |
|---|---|
| Forest-type classification | 90% |
| Forest versus nonforest classification | 95% |
These are developer-reported aggregate results, not independent measurements or guarantees for individual plots. The opened announcement does not supply class-specific or regional accuracy, probability-calibration results, or a separate measure of annual change-detection performance.
The distinction between the two headline scores is important. Correctly identifying an area as forest is a simpler decision than identifying which forest category it belongs to. A supply-chain check concerned with conversion between forest types needs the finer distinction.
ForTy also supplies a probability score for each class, allowing users to choose thresholds for their application. That is more useful than treating every winning label as equally certain.
Frequently Asked Questions
3 questions
1How Much Land Does One ForTy Pixel Cover?
Each pixel measures 10 by 10 meters, covering 100 square meters, or 0.01 hectares. A production plot can contain many pixels and multiple mapped classes.