AI Compute Footprint lets readers model the environmental cost of AI tasks, from a short answer to a functional app, and compare the results with activities such as driving, flying and using electricity at home. Its most useful feature is the ability to inspect the sources, assumptions and confidence behind those estimates.
Created by Tim Plaisted, the project publishes its calculations and underlying data on GitHub. The interface covers electricity, water, carbon dioxide, power demand and data-centre space, with controls for scaling a task from individual use to large populations. The repository lists a research cut-off of 11 October 2026.
That transparency gives readers a practical way to examine environmental claims about AI. A headline number can hide the workload, electricity grid or cooling assumptions behind it. This calculator puts those ingredients within reach, although its results remain estimates of modeled workloads, not measurements of someone’s particular ChatGPT, Claude or image-generation request.
What the Calculator Shows
AI Compute Footprint organises 16 tasks by estimated electricity per task. The list starts with a short answer and moves through images, songs, document drafts, presentations, small programs, video and increasingly substantial software projects.
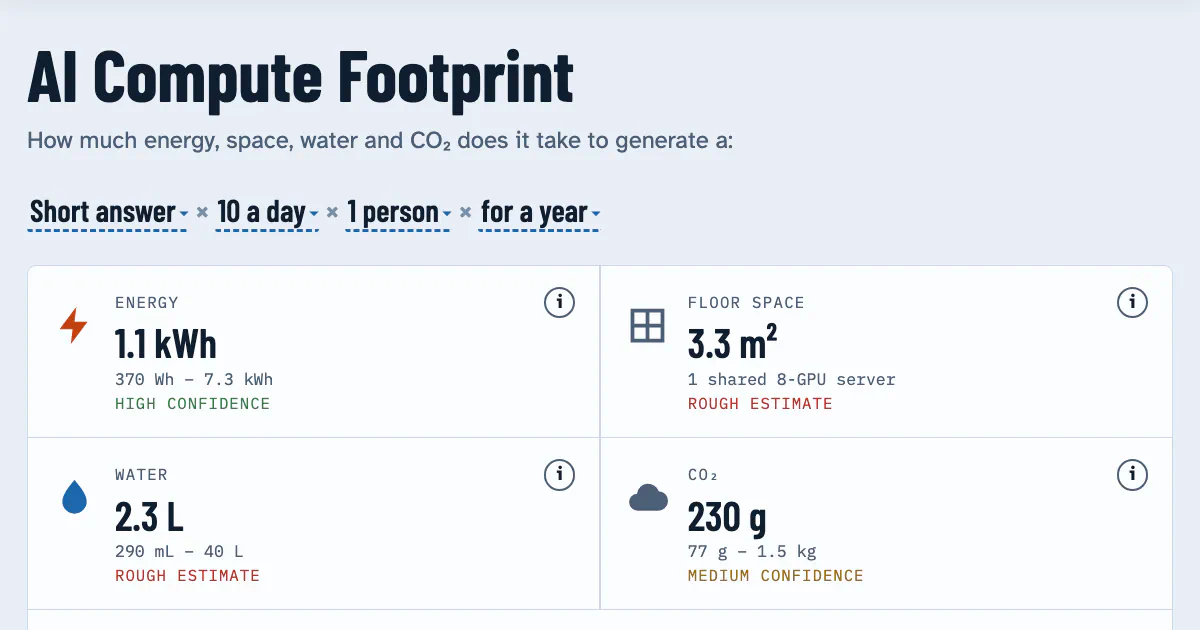
According to the project documentation, an equation bar controls the task, frequency, number of people and period. Readers can change those inputs to explore personal use or a much larger scenario.
The outputs cover several different physical quantities:
- Energy: electricity consumed over the selected period.
- Power draw: the rate of electricity use, shown against references ranging from an LED bulb to worldwide electricity demand.
- Water: an estimate covering on-site cooling and water associated with generating electricity.
- CO₂: electricity-related emissions calculated using a grid-intensity assumption.
- Data-centre space: estimated floor and whole-site area, illustrated against familiar physical scales.
The distinction between energy and power matters. A watt-hour measures an amount of energy; a watt measures a rate. A workload spread over a year can consume substantial electricity without requiring the same power capacity as that workload concentrated into a day.
The page also compares its outputs with activities the selected population already undertakes, including eating beef, driving, flying, home electricity and home water use. Those comparisons make unfamiliar units easier to interpret. They do not, by themselves, make the underlying accounting boundaries equivalent.
I’d use an everyday comparison as a scale reference, then inspect the assumptions before treating it as an environmental ranking. The denominator can matter as much as the headline result.
How the Calculator Builds Its Estimates
The repository makes the model unusually easy to locate: it says every number, range, note and source lives in data/model.js, and the page recalculates from that file. Someone checking an assumption therefore has a defined place to start, without searching through unrelated interface code.
The documented calculation begins with demand:
Tasks = people × share using AI × uses per day × days
It then converts that task count into electricity:
Electricity = tasks × facility-level watt-hours per task
“Facility-level” is an important qualifier. It describes the modeled electricity boundary; it is not simply a reading of a GPU chip’s power consumption.
For groups of 50 people or more, the tool counts only daily AI users by default. That means a population scenario is not automatically equivalent to every person in that population using AI every day.
This default deserves attention when comparing screenshots or shared results. Two scenarios can name the same population yet produce different totals because one uses an adoption share and another assumes universal use. Before debating the total, check how many people the model actually counts.
Water and Carbon Depend on Separate Assumptions
After estimating electricity, the model applies two further conversions:
- Water = electricity × on-site cooling and power-generation water factors
- CO₂ = electricity × grid carbon intensity
These equations explain why a single universal “water per AI request” or “carbon per AI request” figure is difficult to defend. Even with identical modeled electricity consumption, a different cooling factor or electricity mix changes the answer.
The selected grid assumption also needs to describe the computing operation being modeled. A reader’s home country does not automatically identify the grid supplying a remote AI service.
Within this model, doubling the number of tasks doubles electricity, water and carbon when all conversion factors stay fixed. That is a consequence of the published equations. It is not evidence that a real provider’s infrastructure scales perfectly linearly at every level of demand.
The Hardware Display Is a Modeled Equivalent
The infrastructure calculations introduce additional assumptions. The repository uses 1.5 kW per H100-class GPU, all-in, at 70% average draw to convert electricity into GPU time.
Multiplying those figures gives an assumed average of 1.05 kW per modeled GPU. Dividing electricity in kilowatt-hours by that power produces GPU-hours. The model then divides GPU time by eight to estimate server time, and uses further assumptions to estimate GPUs, racks and data centres.
Floor and site area are calculated using whole racks, with a minimum of one, and area-per-megawatt figures from recent AI campuses. Those choices are documented in the README.
The practical consequence is subtle: the space illustration should be read as an infrastructure equivalent, not as proof that one person’s activity occupies a dedicated rack. Electricity can scale continuously in the model while a whole-rack illustration changes in steps. That is a useful visualisation constraint to understand before interpreting a small personal scenario.
Confidence and Sources Are Part of the Interface
The live page includes a “How sure is this?” section with confidence explanations and sources, alongside tables for infrastructure assumptions, grids and per-person comparisons. Information icons provide routes to supporting details.
Those features let readers separate questions that are often blurred together:
- What does the model assume?
- Where did the assumption come from?
- How much confidence should a reader place in it?
A linked source answers only part of that sequence. It may concern a particular model, output length, hardware setup or type of workload. Applying it to a broader category still requires judgment.
The repository puts the central limitation plainly: “Estimates, not measurements.” This article analyses the published page and documentation; it does not independently validate the outputs or measure requests sent to an AI service.
My view is that the inspectable calculation path is the project’s strongest contribution. A disputed estimate can be traced to a task definition, energy assumption or conversion factor. That makes disagreement more productive than arguing over an unexplained final number.
The research cut-off also gives readers a useful timestamp. Estimates assembled from evidence available by 11 October 2026 should be checked against the workload and technology being discussed, especially when newer models or different generation settings are involved.
How It Compares With Another Public Calculator
Dan Taylor-Watt’s AI Environmental Impact Calculator offers a useful comparison. It takes counts of chatbot messages, images, video clips and agentic coding sessions, then estimates annual electricity, CO₂-equivalent emissions and water.
AI Compute Footprint places more emphasis on scaling tasks across populations and visualising infrastructure. Taylor-Watt’s tool foregrounds a personal usage budget, regional grid selection and explicit per-use assumptions.
Its published central estimates and ranges include:
| Activity in Taylor-Watt’s calculator | Central electricity estimate | Published range |
|---|---|---|
| Quick chatbot question | 0.3 Wh |
Frequently Asked Questions
3 questions
1Does AI Compute Footprint Measure My AI Requests?
No. It models selected tasks using published assumptions and sources. It does not measure the electricity or water used by your particular request.