
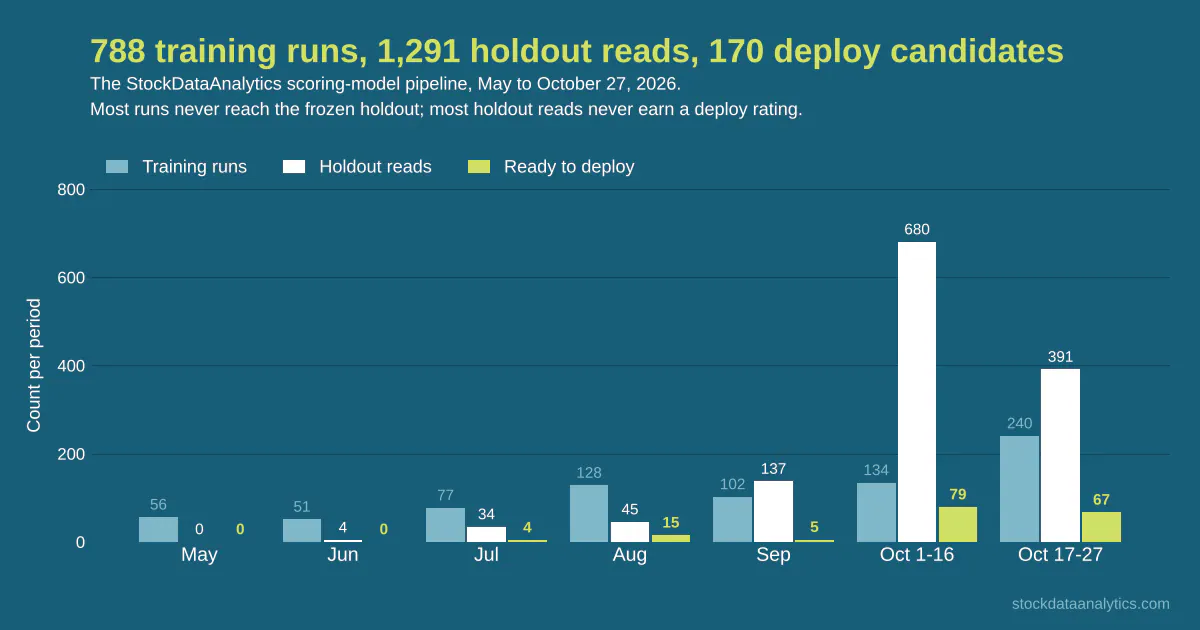
StockDataAnalytics documented six ways its stock-pattern scoring models fooled themselves in an engineering post dated October 27, 2026. Its pipeline has run nearly 800 times since May, supporting a service that scans more than 6,000 U.S. stocks nightly.
The most important finding sits beside the engineering details: the author says live results remain much weaker than holdout results. On this year’s production records, evaluated within each day and market over a one-week horizon, the quality score has ranked market exposure more reliably than outcomes. Only one of sixteen detectors ranked excess return in the intended direction with an uncertainty interval excluding zero.
Those are the operator’s own findings, not independently audited measurements. The engineering post is valuable as an account of validation failures and safeguards, not evidence of a proven trading advantage.
How the Stock-Scoring Pipeline Works
StockDataAnalytics looks for sixteen bullish chart patterns, including ascending triangles, bull flags and double bottoms. Each detection receives a score from 0 to 40:
| Component | Available points | What it describes |
|---|---|---|
| Structure | 15 | The setup’s shape and context |
| Volume | 12 | Trading-volume characteristics |
| Breakout | 13 | The environment in which the pattern formed |
The product needs understandable scores. Its fitter therefore produces an additive model: a table of feature thresholds and points that production code sums. A subscriber should be able to understand why a setup received a particular score.
Training uses up to 90,000 historical detections per pattern, covering January 2022 through March 2026. The data is divided chronologically into training, validation and holdout portions of 50%, 25% and 25%, with purges around boundaries.
A run samples detections, screens candidate features, fits a points model, checks whether the apparent signal beats lucky alternatives, and determines whether another holdout evaluation is justified. The candidate is then assessed against the existing model.
The operator reports typical out-of-sample rank correlations around 0.03, with stronger models reaching 0.08 or 0.09. These measure how well scores order outcomes; they are not win rates. Such small correlations make sampling noise and selection effects consequential. (Pipeline description)
Six Failure Modes Worth Separating
The post names six failure classes: time leakage, selection leakage, calendar leakage, data-draw variance, holdout integrity and tooling leaks.
Their usefulness extends beyond trading. Read as a validation checklist, they expose different routes by which a model can appear better than it is. The explanations below translate those categories into general checks; they are not claims that every example occurred in this system.
Time Leakage
Future information can enter a training example through features, labels or overlapping outcome windows. Sorting records by date alone cannot prevent every overlap.
Purged chronological splits address this problem by removing potentially contaminating observations around boundaries. For another team, the useful question is whether every input was available at prediction time, and whether training outcomes extend into the evaluation period.
Selection Leakage
A feature or model can win because many alternatives were tried. Selecting the best result introduces optimism even when no evaluation row enters the fitting process.
The pipeline explicitly checks whether a fit beats the best of many lucky attempts. The broader lesson is to evaluate the selection process, including feature screening and candidate choice, rather than treating the winning model as a single untouched experiment.
Calendar Leakage
Many stock observations share the same market day. A model can benefit from common market conditions while appearing to identify something specific about individual setups.
This is distinct from looking into the future. The practical check is whether performance survives comparisons within the relevant time period and market, instead of relying on pooled results across different conditions.
Data-Draw Variance
Different samples and random seeds can produce different winners. One attractive fit may owe too much to which observations happened to be selected.
StockDataAnalytics uses repeated-fit controls and holds a strategy’s configuration constant while varying seeds. For applied-ML teams, stability across reasonable draws is useful evidence alongside the best score.
Holdout Integrity
A frozen holdout remains unchanged, but repeated access can still influence development. Each result tells the team something about which choices work on that dataset.
The pipeline maintains a holdout registry and logs reads. That makes evaluation history visible, although logging alone cannot undo information already learned.
Tooling Leaks
Supporting software can compromise the separation that an experimental design promises. Extraction, feature screening, caching and evaluation code all deserve scrutiny.
The practical implication is straightforward: review the measurement pipeline as carefully as the model. A documented split policy only helps if the code consistently enforces it.
A Frozen Dataset Is Not a Frozen Decision Process
One example in the post makes repeated holdout access unusually concrete. An inverse-head-and-shoulders candidate reached evaluation after seventeen earlier reads of that holdout, all logged. The candidate reportedly achieved a 71.6% holdout win rate at scores of 36 or higher, compared with 54.5% for the existing model, and was installed for a parallel run.
That history matters more than the headline improvement. Keeping holdout rows out of training protects one boundary. It does not stop engineers from adapting strategies, thresholds or candidate choices in response to previous results.
My reading is that the registry is valuable because it turns this adaptation into something observable. It should not be read as a guarantee that the holdout remains pristine.
The operator says its training codebase contains about 88,000 lines of Python, with fitting accounting for only a small part. Most of the surrounding work concerns splits, gates and records. Line count is not a quality metric, but the allocation illustrates how much engineering a credible measurement system can require. (Holdout example and tooling)
Live Results Set a Different Bar
The ten candidate models installed for parallel runs on October 15 reportedly won 61% to 82% of simulated trades scoring at least 36 on their holdouts.
Frequently Asked Questions
3 questions
1Can a Frozen Holdout Still Be Overfit?
Yes. Repeated evaluations can guide later development choices even when the holdout never enters model fitting.