
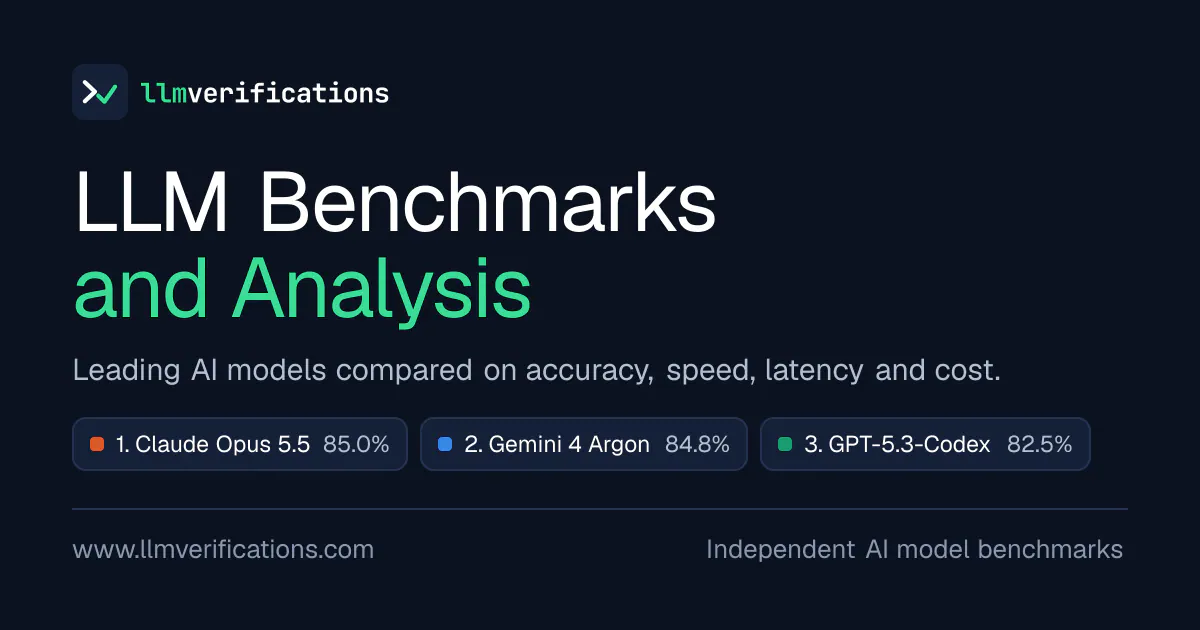
LLM Verifications’ October 27, 2026 benchmark snapshot puts Claude Opus 5.5 first for verification accuracy, Nemotron 3.5 Super VL first for output speed, Granite 4.0 Micro first for billed cost, and Ministral 3 3B 2512 first for time to first token. Four measures produce four different leaders, which is the most useful thing about this leaderboard.
The independent testing project compares more than 70 models through OpenRouter’s public API. Its published results separate an 80-question accuracy test from generation speed, initial response latency and actual billed cost. These are LLM Verifications’ reported measurements, not model-vendor benchmark claims. The current results are dated October 27.
For anyone choosing an LLM for an AI product, the important step is deciding which constraint matters first. A model that starts responding quickly may generate slowly afterward. A cheap answer may fail the task. A small accuracy lead may amount to only one or two questions.
The leaderboard helps expose those tradeoffs. Its methodology and category counts also show where the rankings should stop influencing a purchasing decision.
Four Metrics, Four Different Leaders
LLM Verifications lists these leaders for its latest run:
| Metric | Listed leader | Reported result | What it measures |
|---|---|---|---|
| Verification score | Claude Opus 5.5, Anthropic | 85.0%, or 68/80 | Correct answers on the question suite |
| Output speed | Nemotron 3.5 Super VL, NVIDIA | 715 tokens/second | Median generation throughput on the speed task |
| Cost per question | Granite 4.0 Micro, IBM | $0.000051 | Average billed cost, including reasoning tokens |
| Time to first token | Ministral 3 3B 2512, Mistral | 0.3 seconds | Median wait for the first token |
The latency result is less exclusive than a first-place label suggests. Ministral 3 8B 2512 and Hermes 4 405B also display 0.3 seconds. At the precision shown, all three share the same response time.
The page also has a coverage-count inconsistency. Its header and quick-answer section say 78 models, while the score, speed and cost panels each show 15 entries followed by 57 more, implying 72. The latency panel implies 74. The page does not explain the difference, so “more than 70 models” is the safest description of the published snapshot.
I’d treat the four columns as separate filters. The top accuracy score is useful for building a quality shortlist; it cannot tell you which model will feel responsive in a chat interface or fit a high-volume processing budget.
What the Verification Score Actually Tests
LLM Verifications uses Verification suite v2, a set of 80 multiple-choice questions drawn from two public datasets:
- SuperGPQA: 50 hard questions, sampled by discipline.
- MMLU-Pro: 30 questions from its test split, sampled by subject.
Each question has ten options, labeled A through J, and one answer from the dataset’s answer key. Random guessing would average about 10%. Despite the project’s name, this is a multiple-choice knowledge and reasoning benchmark, not a test of formal software verification. The methodology describes the sampling and grading process.
The grading mechanism is deliberately simple. Each prompt asks the model to put its final answer on the last line using an ANSWER: marker followed by a letter. The harness takes the text after the last marker, or the last non-empty line if no marker appears, and normalizes formatting before comparing it with the answer key.
There is no partial credit, human judging or second model grading the response. That makes the scoring easier to inspect, although the score remains a measure of success on these particular multiple-choice questions. It does not directly measure citation quality, conversational usefulness, tool use or whether generated code works.
The Settings Define the Comparison
The project says its version 0.1.0 harness is a single Python script using the standard library. It calls models through OpenRouter’s public chat completions API with streaming enabled.
The documented request conditions matter:
| Setting | Published configuration | Practical consequence |
|---|---|---|
| Quality-test temperature | 0 | Reduces sampling variability, without making every part of the service deterministic |
| Reasoning effort | Low, where supported | Results describe this setting, not every model’s maximum reasoning configuration |
| Quality output limit | 4,000 tokens, including reasoning | Reasoning and visible answers share the output allowance |
| Speed-run output limit | 700 tokens | Throughput is measured within a bounded generation task |
| Timeout handling | Stop the request and record a failure | The harness’s time limit is part of the test conditions |
A low reasoning-effort setting is a consequential detail. Models accepting that parameter receive it; models without support receive no reasoning parameter. The requests follow a consistent policy, but that policy does not guarantee equivalent internal computation across model families.
These are also API-service results. The harness records which host served each request, along with the request body, streamed response, timing and token counts. Hosting and routing are therefore part of the measured experience, not background details that can be ignored when comparing the result with another deployment.
Small Samples Make Close Rankings Fragile
Claude Opus 5.5 leads with 68 correct answers out of 80. GPT-5.3-Codex and Gemini 3.8 Flash each score 82.5%, equivalent to 66 correct answers on the full suite. That makes the gap between the leader and those two models two questions. The leaderboard provides the scores and category counts.
One additional correct answer changes an 80-question score by 1.25 percentage points. A narrow ranking gap can therefore look more precise than the underlying evidence supports.
LLM Verifications acknowledges this. Its methodology gives a 95% Wilson interval of 51.5% to 72.3% for a model scoring 62.5% on 80 questions. That example illustrates the sampling uncertainty; it is not an interval for every model in the table.
The site says its comparison pages only declare an accuracy winner when a two-proportion z-test reaches an absolute z-value of at least 1.96. For speed, latency and price, it requires a difference of at least 10% before calling a winner. The ranking tables still sort by the raw values. Those decision rules are documented separately from the leaderboard.
That distinction is worth keeping: first in a sorted table and convincingly ahead are different claims.
Category Scores Can Move Sharply on One Answer
The subject breakdown is useful because an aggregate score can hide uneven results. It is also where the sample-size problem becomes most obvious.
The following percentage-point changes are calculated from the published category sizes:
| Category | Questions | Change in category accuracy from one answer |
|---|---|---|
| Science | 30 | 3.3 percentage points |
| Engineering | 15 | 6.7 percentage points |
| Medicine | 11 | 9.1 percentage points |
| Economics | 9 | 11.1 percentage points |
| Law | 6 | 16.7 percentage points |
| Humanities and social science | 9 | 11.1 percentage points |
Gemini 4 Argon and Gemini 3.8 Flash both show 6/6 in law, while Claude Opus 5.5 shows 5/6. That is a difference of one question. A perfect six-question result is a reason to investigate further, not a basis for calling a model dependable for legal work.
The overall score also embeds a subject weighting. Science and engineering account for 45 of the 80 questions, or 56.25% of the suite. Law contributes six. A team building a legal research product should not assume that the overall ranking reflects its workload simply because a law column appears beside it.
My view is that these category cells work best as prompts for a larger, task-specific evaluation. The counts reveal where a model may deserve attention; they are too small to support a confident specialist ranking.
Gemini 4 Argon Has a Different Displayed Denominator
One detail deserves clarification before readers compare the top two scores too closely.
Claude Opus 5.5’s category counts add up to 68/80, matching its 85.0% score. Gemini 4 Argon’s engineering cell is 13/14, even though the category header specifies 15 questions. Its displayed category results total 67/79, which rounds to the listed 84.8%.
That arithmetic explains the displayed percentage, but the page does not explain why one engineering question is absent from Gemini’s denominator. It could affect how readers interpret the 0.2-percentage-point gap at the top. The published cells support a narrow numerical lead for Opus; they do not support treating the two results as a clean, identical-denominator comparison. Both rows appear in the category table.
Output Speed Is Not Initial Response Speed
Nemotron 3.5 Super VL’s reported 715 tokens per second is a throughput result. Ministral 3 3B 2512’s 0.3 seconds is a startup-latency result. Those numbers answer different product questions.
Time to first token matters when a user is waiting for visible activity. Output throughput matters as the response continues, especially for long answers. A model can start quickly and then produce text slowly, or pause longer before generating a rapid stream.
Tokens are model text units, not words, so a token-per-second figure should not be read as a word-per-second rate.
The speed test also uses a different workload from the accuracy test. According to the methodology, each model streams the same fixed prompt three times. The prompt asks for about 300 words explaining how a household refrigerator works, including the refrigerant cycle, compressor, condenser and evaporator.
Frequently Asked Questions
3 questions
1Does This Benchmark Test Formal Verification?
No. Its verification score comes from 80 multiple-choice questions drawn from SuperGPQA and MMLU-Pro. It does not measure theorem proving or software correctness proofs.