Ixian-Bench Measures VLA Models on Jetson | Zeniteq
Loading
Loading article
Ixian-Bench Measures VLA Models on Jetson
ZETIC’s public benchmark puts latency, energy, power and memory figures beside robotics models, exposing deployment trade-offs that speed alone misses.
ZETIC’s ixian-bench provides critical performance metrics for VLA models like π0.5, SmolVLA, and GR00T N1.7 on NVIDIA Jetson AGX Thor and Orin hardware. By measuring latency, power, energy, and memory under both eager and compiled execution, the benchmark reveals complex deployment trade-offs. For instance, while torch.compile significantly reduces energy per call and latency, it can simultaneously increase average board power and peak memory usage. These findings demonstrate that optimizing for speed alone may inadvertently strain thermal limits or memory headroom on constrained edge devices, forcing developers to balance responsiveness against battery life and system stability.
ZETIC announced ixian-bench on October 28, 2026, publishing measurements of vision-language-action models on NVIDIA Jetson AGX Thor, AGX Orin and Orin Nano boards. Its announcement on the NVIDIA Developer Forums includes results for π0.5, SmolVLA and GR00T N1.7, giving robotics developers a hardware-specific starting point for deployment decisions.
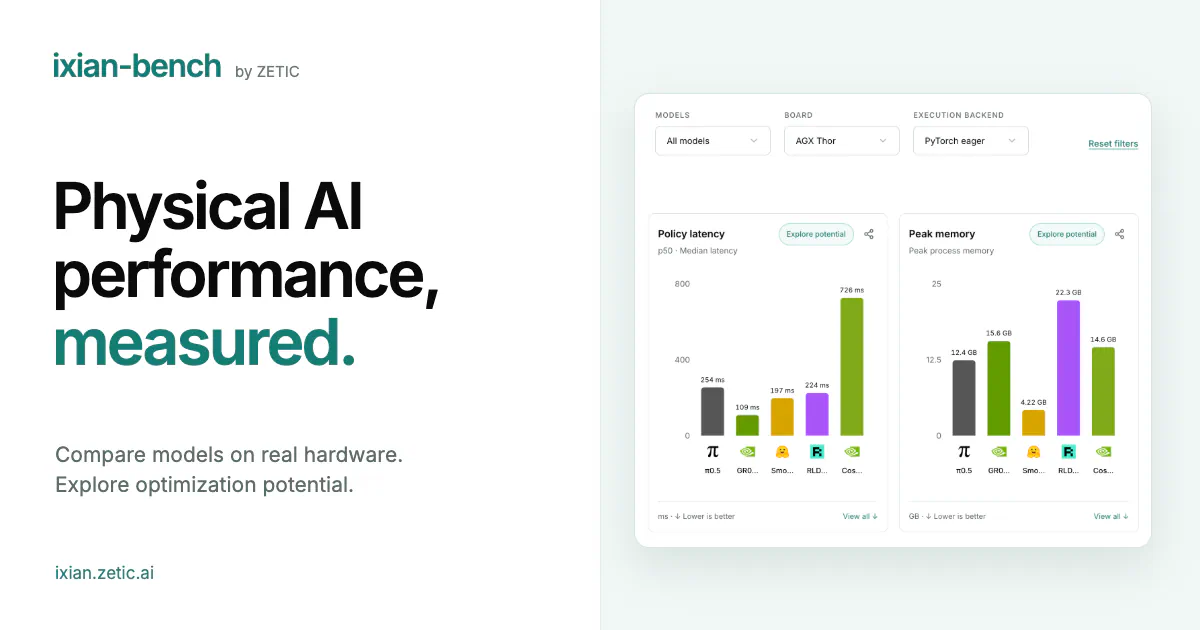
The useful finding is a trade-off: on AGX Thor, torch.compile makes π0.5 and SmolVLA faster and reduces energy per policy call, while increasing average board power. Compilation also pushes SmolVLA’s reported peak memory from 4.22 GB to 6.76 GB.
Those changes matter differently to a battery-powered mobile robot, a continuously operating workstation and an 8 GB edge device. The public comparison dashboard helps frame those choices, but the published figures need careful reading.
These are ZETIC’s measurements, not independent tests. The company discloses that it sells edge inference optimization services and labels its optimized implementations separately.
What the AGX Thor Results Show
The announcement’s detailed snapshot uses BF16 precision and batch size one. BF16 is a 16-bit floating-point format; batch size one means the model processes one input sample per inference batch.
For π0.5, the listed checkpoint is lerobot/pi05_libero_base; for SmolVLA, it is lerobot/smolvla_libero. Those identifiers matter because a model family name alone leaves checkpoint and task configuration ambiguous.
Latency covers preprocessing through postprocessing, measured per policy call or action chunk as the model defines it. The methodology records p50 and p90 latency, although this snapshot supplies p50, the median.
That boundary makes the numbers more useful than a timing limited to a single neural-network operation. It still requires interpretation: one model call can produce an action chunk containing multiple future actions. A 50 ms call therefore does not automatically mean the robot’s motors update at 20 Hz. Camera handling outside the measured boundary, control software and action scheduling also affect the deployed system.
Compiled SmolVLA has the lowest median latency in this table. GR00T N1.7’s eager result is faster than compiled π0.5, but uses more memory. Neither observation identifies the most capable policy. ZETIC reports task success on each model’s own evaluation suite, so success scores cannot be treated as a shared leaderboard. Physical-robot validation applies only when a result explicitly says so.
Lower Energy Can Come With Higher Power
Compilation cuts π0.5’s median latency by about 48%, from 254 ms to 132 ms. Average board power rises by roughly 27%, while energy per call falls by about 32%.
SmolVLA shows a larger shift:
Median latency falls about 75%, from 197 ms to 50 ms.
Average board power rises about 54%, from 43.4 W to 66.9 W.
Energy per call falls about 61%, from 8.58 J to 3.35 J.
These percentages are calculated from ZETIC’s published values. The mechanism behind the apparent contradiction is straightforward: watts measure the rate of energy use, while joules measure the amount consumed. A higher-power operation can use less total energy if it finishes sufficiently sooner.
ZETIC calculates energy per inference as average board power × measured window duration ÷ inference count. Power comes from tegrastats over an approximately 60-second steady-state window. The energy figure is consequently a window-level average, not average power multiplied by median latency. Those calculations can differ because the median is not the mean duration across the run.
The practical consequence depends on the robot’s workload. If it needs a fixed number of policy calls and can spend the saved time in a lower-power state, lower joules per call can help its battery budget. If it continuously runs inference as fast as possible, the higher average power becomes a cooling and energy-supply concern.
I’d use energy per call to compare the cost of completing inference work, then separately check sustained watts against the enclosure’s cooling capacity. Treating either number as a complete battery-life forecast would miss the workload’s duty cycle, idle consumption and the rest of the robot.
These are board-level measurements. They do not include a complete robot’s motors, external sensors or other equipment.
AGX Orin Is Slower, but Draws Less Power
The announcement provides a narrower comparison for AGX Orin: π0.5 reaches 949 ms median latency in eager mode and 394 ms with torch.compile. Reported average board power is 28.6 W and 43.5 W, respectively.
Against the corresponding Thor figures, those results imply:
Orin’s lower wattage is useful for a constrained power supply, but it is insufficient to establish better energy efficiency. The announcement excerpt does not provide Orin energy-per-call values, and multiplying its power by p50 latency would not reproduce the disclosed window-based method.
For deployment, the first question is whether the policy’s response time meets the application’s needs. A lower-power board offers little benefit if its policy arrives too late for the intended behavior. Conversely, a task that tolerates slower policy updates may not need Thor’s latency advantage.
The dashboard covers Orin Nano too, but the announcement’s numerical snapshot does not provide a complete Nano comparison for these three models. It should not be read as proof that a particular Nano configuration fits or meets a timing target.
SmolVLA’s Memory Increase Is the Small-Board Warning
SmolVLA’s compiled peak memory is 6.76 GB on Thor, up from 4.22 GB in eager mode. That is an increase of 2.54 GB, or about 60%.
π0.5 moves in the opposite direction, dropping slightly from 12.4 GB to 11.9 GB. Compilation’s memory effect is therefore configuration-dependent; it is not a fixed surcharge developers can apply to every model.
The measurement is also broader than model-weight size. ZETIC defines it as peak board memory above idle, using MemTotal − MemAvailable, across the full command including model loading. That captures a deployment concern a checkpoint’s download size cannot answer.
The tested Orin Nano Super Developer Kit has 8 GB of memory. A Thor result of 6.76 GB does not prove the same configuration will consume exactly that amount on Nano. It also cannot safely be subtracted from the kit’s advertised capacity to calculate remaining application memory: the benchmark reports an increase above an idle baseline, not total occupied memory.
The useful inference is narrower. SmolVLA’s compilation benefit comes with enough extra memory use to make an 8 GB deployment worth checking carefully. Camera buffers, middleware and the application’s other processes need room too.
My preference would be to establish memory headroom on the target board before committing to the fastest backend. A 50 ms benchmark result is attractive, but a configuration that cannot coexist with the robot’s software stack is not deployable.
Hardware: AGX Thor Developer Kit with 128 GB, AGX Orin Developer Kit with 64 GB, and Orin Nano Super Developer Kit with 8 GB.
Software: JetPack 7.2.1, L4T R39.2.1, CUDA 13.2.2 and PyTorch 2.14.1+cu130 using an aarch64 wheel.
Compiled execution: PyTorch Inductor with mode="reduce-overhead".
Power modes: MAXN on Thor and AGX Orin; MAXN_SUPER on Orin Nano.
Clocks: pinned using jetson_clocks, with reported GPU clocks of 1,575 MHz on Thor and 1,300 MHz on AGX Orin.
Isolation: one measurement at a time per board, with availability and GPU-idle checks before each window. The harness aborts if clock pinning fails.
These conditions improve comparability, but they also define the scope of the results. MAXN modes and pinned clocks are not equivalent to every robot’s production power policy. A sealed enclosure or a lower operating limit needs its own measurements.
The full-command memory measurement includes loading, while power is sampled during steady-state operation. Those are different measurement windows serving different purposes. Teams that frequently restart a policy will still need to investigate startup time and startup energy.
TensorRT Is a Separate Comparison
The announced benchmark includes PyTorch eager and torch.compile; TensorRT had not yet been measured.
In an October 29 reply to the announcement, forum participant AastaLLL pointed to a reported 49 ms π0.5 result using TensorRT with FP8 and NVFP4 precision.
That is relevant deployment context, but it is not a like-for-like replacement for ixian-bench’s BF16 results. Backend and numerical precision both change, and the reply does not supply matching energy and memory measurements for that comparison.
ZETIC says its own optimized builds appear as separately labeled implementation paths. Configurations that change precision or step count are recorded separately and excluded from its fastest-path comparison.
For robotics teams, I’d use the benchmark to select a shortlist, then validate four things together on the intended board: the policy’s task performance, latency including slower calls, memory headroom and sustained power. The published results already show why selecting solely by the lowest millisecond figure can lead to a different deployment choice than selecting for battery consumption or available memory.
Frequently Asked Questions
3 questions
1
Which Model Has the Lowest Published Thor Latency?
Compiled SmolVLA has the lowest median latency in the announcement’s Thor snapshot at 50 ms. That is a speed result, not a shared-task capability ranking.
2
Does Lower Energy per Call Mean Lower Power?
No. Compiled π0.5 and SmolVLA use fewer joules per call while drawing more average board power. Battery impact depends on inference frequency and what happens between calls.
3
Do the Results Prove SmolVLA Fits on Orin Nano?
No. The cited 4.22 GB and 6.76 GB memory figures come from Thor. Nano needs its own measurement, including the operating system and the robot’s other software.