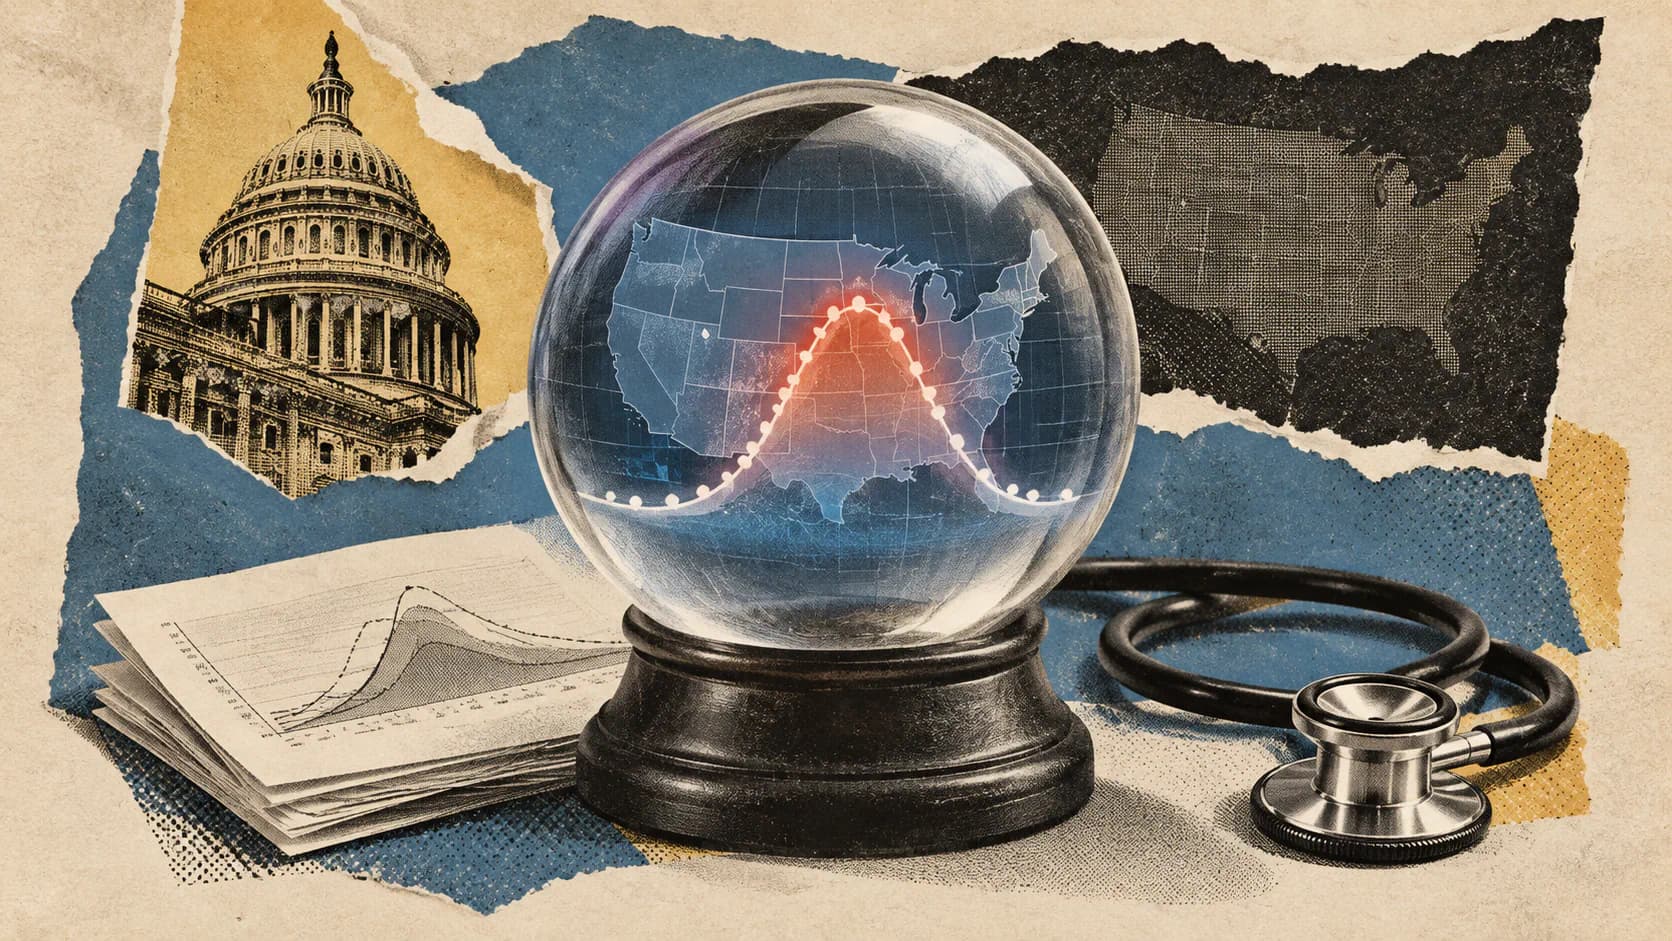
An AI-assisted forecasting model from Google finished first among individual-team submissions in the CDC’s evaluation of the 2025–26 U.S. flu season. Google_SAI-FluEns was assessed alongside other eligible approaches from academic, government and industry teams. The evaluation scored forecasts submitted during the season against hospital admissions observed later, giving the result a firmer footing than a demonstration built around historical data.
It is a concrete example of AI helping researchers build an algorithm for a public-health task. The CDC measured forecasting performance under a particular scoring method, though. It did not measure whether Google’s forecasts changed staffing decisions, reduced hospital strain or improved patient outcomes.
Google Led the Individual-Team Field
The CDC’s FluSight evaluation, published September 30, 2026, included 39 eligible models from a larger set of submissions. Google_SAI-FluEns led the individual-team entries on the report’s primary metric: average relative weighted interval score across the season and the jurisdictions included in scoring.
The CDC also evaluates its own FluSight ensemble, which combines forecasts from participating models and is used in the agency’s forecast messaging. That ensemble ranked seventh among the 39 models. Google’s result identifies the strongest individual-team submission under the CDC’s evaluation; the agency did not replace its ensemble with Google’s model.
Teams forecast weekly influenza hospital admissions for the current week and up to three weeks ahead. The evaluation covered state-level jurisdictions and Washington, D.C. National forecasts were excluded from the main scoring because of differences in scale, and Puerto Rico forecasts were excluded because of data availability. Models had to submit at least 75% of the relevant forecasts to qualify.
The field was substantial, though “39 models” does not mean 39 independent organizations. The CDC says 34 teams contributed forecasts from 53 unique models, of which 39 met the evaluation’s inclusion criteria. Google’s result is a comparison against many eligible forecasting approaches, not a claim that it beat 38 separate institutions.
The Score Rewards Useful Uncertainty, Not Just a Close Guess
A hospital planner needs more than a single predicted admission count. A plausible range helps account for demand that comes in higher or lower than the central estimate. The CDC’s primary metric, weighted interval score, evaluates those prediction intervals against the admissions eventually recorded. Lower scores are better.
The CDC reported relative weighted interval scores, comparing performance with a baseline that carries forward the previous week’s admission level while accounting for uncertainty. A relative score below one indicates performance better than that baseline. Thirty-three of the 39 evaluated models cleared it, according to the CDC. Google led the individual-team submissions in a field where many models were already better than that simple reference forecast.
The CDC’s scoring methods also limit how broadly the ranking should be read. The agency used log-transformed admission counts to reduce the influence of differences in count size between jurisdictions. It compared models on forecast targets they shared and aggregated performance across the season. A strong overall position does not establish that a model was best in every state, every week or every forecast horizon.
Point predictions tell only part of the story. A model can miss the eventual admission count yet provide a useful uncertainty range; it can also land near the count while expressing uncertainty poorly. The CDC separately examined coverage, or how often observed admissions fell within models’ prediction intervals. The ranking reflects the quality of probabilistic forecasts under the agency’s chosen evaluation, not simply which entry guessed the closest number most often.
The government result is more informative than a vendor-selected example. Its scope remains narrower than a claim that one algorithm is generally the best way to predict infectious disease.
Google Says AI Helped Develop the Forecasting Algorithm
Google attributes the forecasting approach to Empirical Research Assistance, or ERA, an AI-assisted research system it says generates optimization algorithms for scientific tasks. Its claim concerns how researchers developed the forecasting method. Google is not claiming that a general-purpose chatbot independently ran the CDC’s forecasting operation or made public-health decisions.
In an April account of its research, Google described a progression from retrospective work on COVID-19 hospitalization forecasts to weekly, real-time submissions for flu, COVID-19 and respiratory syncytial virus. The completed CDC flu evaluation puts the flu work to a more demanding test than a result demonstrated solely on past data. Submitted forecasts had to face admissions that were not yet known when the forecasts were made.
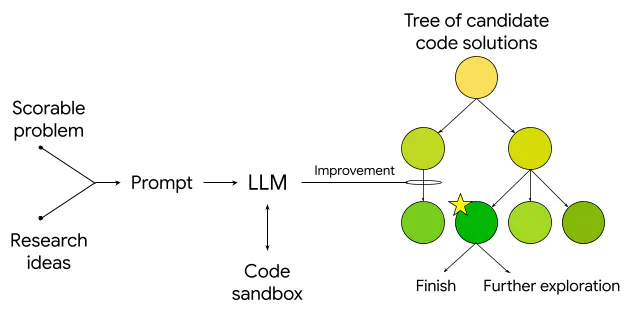
The evidence has two sources. The CDC independently scored the submitted forecasts and identified Google’s ranking. Google is the source for its account of ERA’s role in developing the approach. The CDC result supports a claim about forecasting performance; it does not, by itself, audit every step in Google’s AI-assisted research process or isolate how much of the final model’s performance came from ERA rather than other research decisions.
The AI system’s reported contribution was to help create a domain-specific forecasting algorithm whose output could then be tested in a recurring, externally evaluated task. Readers need not accept a broad claim about autonomous scientific discovery to recognize the narrower achievement: an approach Google says was developed with AI led a competitive government evaluation of flu forecasts.
Fast-Moving Flu Trends Remain a Hard Test
Season averages can conceal the weeks when a forecast matters most. Hospital systems have particular reason to care about the onset of a surge or a sharp change near the peak, when trends become difficult to extrapolate.
The CDC reported declines in forecast performance around rapidly changing influenza trends during the 2025–26 season. Its report shows that the FluSight ensemble’s prediction intervals failed to anticipate increases in admissions in late December 2025 and decreases in mid-January 2026. Those are documented difficulties for the CDC ensemble, not specific errors that can be attributed to Google_SAI-FluEns without corresponding evidence about Google’s forecasts for those weeks.
Google’s published overall rank is a strong season-level result, but it leaves operational questions open. A public-health user would also want to know how reliably the model handled turning points in a particular jurisdiction, how its three-week-ahead forecasts compared with its current-week forecasts, and whether its uncertainty ranges remained dependable during surges.
One season cannot establish performance across future flu seasons, different surveillance systems or other pathogens. Forecasting methods can be valuable without being universally best. Repeated prospective evaluations would show whether this advantage persists when the timing, severity and geography of outbreaks change.
Forecast Accuracy and Public-Health Benefit Are Different Claims
The CDC’s evaluation establishes how submitted forecasts compared with observed hospital admissions under defined rules. Whether anyone made a better decision because Google’s entry ranked first is a separate question. Answering it would require evidence about how forecasts were used, which decisions changed, and whether those changes improved results relative to a credible alternative.
Even a more accurate forecast does not automatically lead to better outcomes. It has to reach the right people in time, express uncertainty they can act on, and improve a decision that can still be changed. A forecast that does not rank first on a season-long score may also be useful in a particular setting. The connection between predictive skill and operational benefit has to be tested.
Independent scoring against many eligible submissions is a meaningful hurdle for an AI-assisted research approach, especially when forecasts were made during the season instead of fitted only after it ended. Google showed leading individual-team forecast performance in this evaluation. The public-health effect of using that performance remains unmeasured here.
Final Thoughts
A system Google says helped design a forecasting approach produced an entry that led individual teams in an ongoing government evaluation. That setting provides more concrete evidence of useful AI-assisted research than a demonstration chosen and scored solely by its developer.
The next test is less likely to produce a simple headline. Continued performance across seasons, particularly during abrupt changes in admissions, would give forecasters stronger grounds to trust the model. Showing that its use improves decisions would require a different kind of study. For now, the CDC result is a significant forecasting win with a clearly defined boundary.
Frequently Asked Questions
4 questions
1Did Google’s AI flu model rank first in the CDC evaluation?
Google_SAI-FluEns was the top-performing individual-team submission in the CDC’s evaluation of eligible 2025–26 flu hospitalization forecasting models. The CDC assessed 39 models using a season-long measure of forecast performance across included state-level jurisdictions. Its own FluSight ensemble, which it uses for forecast messaging, ranked seventh overall.
2What did the CDC measure in its flu forecast ranking?
The CDC primarily measured relative weighted interval score for weekly hospital-admission forecasts covering the current week through three weeks ahead. The metric evaluates prediction intervals against admissions later observed, then compares performance with a baseline forecast. The main scoring excluded national forecasts and Puerto Rico; it was not a test of whether the forecasts improved patient care.
3How did Google use AI to develop the flu model?
Google says it used Empirical Research Assistance, an AI-assisted research system that generates optimization algorithms for scientific tasks, to develop its forecasting approach. The CDC independently evaluated the resulting forecast submissions, but its ranking does not verify every part of Google’s account of the development process or quantify ERA’s contribution separately from researchers’ other work.
4Does the CDC result prove Google’s model will improve hospital planning?
No. The CDC result shows that Google’s entry led individual-team submissions on a defined forecast-accuracy measure for one U.S. flu season. It does not show that hospitals used the forecasts, changed staffing or other decisions because of them, or achieved better outcomes. Those questions require evidence beyond a ranking of predictions.
Sources
- CDC’s FluSight evaluationcdc.gov
- Empirical Research Assistance, or ERAblog.google
- April account of its researchresearch.google