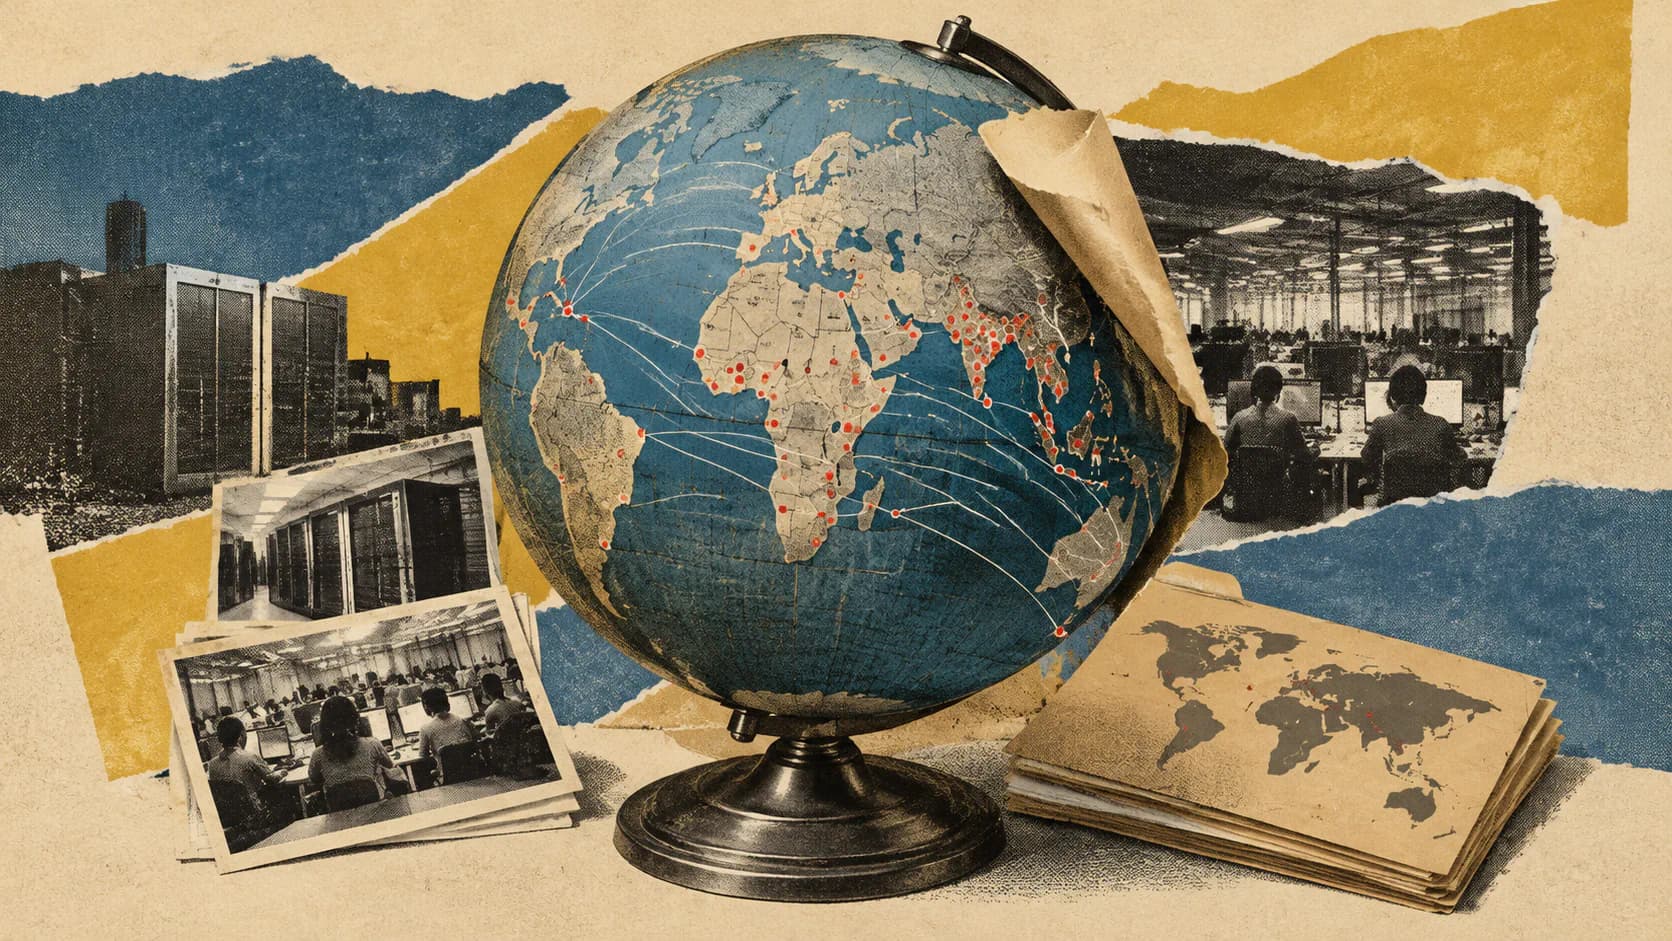
Brown senior Cunyan Ma has created a freely available interactive map connecting 13 data-labeling companies, 141 corporate customers and worker sites across 31 countries, according to Brown University’s October 26, 2026 announcement. The project brings together relationships that can be difficult to trace when customers, contractors and workers operate in different places.
The useful distinction is between mapping a supply chain and measuring its workforce. Ma’s project makes documented connections more visible, but its geographic layer uses labeling companies’ delivery centers as a proxy for worker locations. That gives readers a starting point for examining AI sourcing, with boundaries around what a connection can tell them.
What the Map Includes
Ma developed the public interactive map while working with Brown’s Center for Technological Responsibility, Reimagination and Redesign. Her advisor is Suresh Venkatasubramanian, a Brown computer science professor who leads the center.
The network links corporate customers to specialist labeling firms, then connects those intermediaries to locations associated with data work. Its three headline figures describe different parts of that structure:
| Mapped category | Coverage reported by Brown | What the count measures |
|---|---|---|
| Data-labeling companies | 13 | Intermediaries supplying data-labeling services |
| Corporate customers | 141 | Customers connected to those intermediaries |
| Countries containing worker sites | 31 | Geographic coverage, using delivery-center locations as a proxy |
These are coverage counts, not employment statistics. A country represented on the map might contain one identified delivery center or several. A customer connection says nothing by itself about the number of workers assigned to that customer.
That distinction matters because a network can look extensive without capturing a large share of an industry’s labor. The figures show the scope of Ma’s collection; they provide no denominator for calculating what percentage of global data work it covers.
The Human Tasks Behind AI Products
Data labeling covers several kinds of work. Brown’s announcement describes tasks that range from identifying objects in photographs to judging chatbot responses. Each supplies human interpretation that can help shape an AI system’s behavior.
Examples include:
- Image annotation: Identifying objects in photographs or marking tumor boundaries in medical scans.
- Speech transcription: Turning recorded speech into text that can support speech-related AI development.
- Language labeling: Identifying parts of speech or other features within text.
- Response rating: Judging whether a chatbot’s answer is good or bad, providing feedback that can inform training.
- Harmful-content labeling: Identifying disturbing material so systems can learn to recognize or filter it.
These tasks involve different skills and risks. Marking a boundary in a scan demands a different kind of judgment from evaluating a conversational answer. Work involving violent or sexually abusive material also carries an exposure risk that an ordinary label such as data annotation can obscure.
Brown’s account emphasizes that some workers must examine disturbing text or images as part of efforts to make AI systems safer. Those examples explain why labor conditions belong in discussions of AI development. They should not be read as a description of every company or job represented on the map.
How Databases, Delivery Centers and Reporting Fit Together
Ma assembled the project from three types of material: existing databases, her own data collection and news reporting. Each supports a different part of the picture.
Existing databases provide company relationships. Brown says Ma used databases of labeling firms and their corporate customers. These relationships form the commercial layer of the network: who buys services from whom.
Ma’s original collection provides delivery-center locations. She built a database of labeling companies’ delivery centers and used those locations as a proxy for where data workers are based. This adds geography to the corporate relationships.
News reporting supplies context about working conditions. Reporting can describe pay, workplace experiences and the nature of particular assignments. It adds detail that a company-to-company connection cannot convey on its own.
Keeping these evidence types separate is essential. A corporate relationship, a delivery-center address and a reported account of working conditions answer different questions. Combining them can expose a structure, but it cannot make every underlying claim equally complete or current.
The consequential detail is the delivery-center proxy. A delivery center is an organizational location associated with a service provider. It is not a verified location for each individual worker, and its presence alone does not identify which customer’s work takes place there.
Consider the network’s basic logic: if a customer uses a labeling firm, and that firm has a delivery center in a particular country, those two connections offer a sourcing lead. They do not automatically demonstrate that the customer’s assignments were handled at that center. That would require more specific evidence about the allocation of work.
What a Mapped Connection Can Support
I’d use this map as a starting point for a sourcing inquiry, because its strongest contribution is identifying relationships worth examining. A customer name becomes more useful when it can be connected to a contractor and a geographic footprint.
For a company buying labeling services, that structure suggests concrete follow-up questions:
- Which delivery centers handle its assignments?
- Are additional subcontractors involved?
- What kinds of material do workers encounter?
- What evidence supports the supplier’s statements about pay and worker protections?
These are practical implications of the map’s structure, not checks that the project is reported to have completed.
The same reasoning helps avoid two common misreadings. First, a mapped relationship cannot by itself establish the working conditions attached to every assignment. Second, an absent company or country cannot be treated as evidence that no relationship exists. In an incomplete collection, absence may simply reflect a coverage gap.
Ma explicitly describes the map as illustrative, not comprehensive. The evidence available for this article also has a clear boundary: Brown’s announcement supplies the substantive account, while the opened map page exposes only its title. Its individual records, interface behavior and underlying databases could not be independently assessed from the supplied material, nor could the labor reporting behind particular entries.
Frequently Asked Questions
3 questions
1Who Created the AI Labor Map?
Brown senior Cunyan Ma created it while working with the university’s Center for Technological Responsibility, Reimagination and Redesign. Professor Suresh Venkatasubramanian advises the project.