About a third of the ultraviolet sky map showcased by Anthropic is predicted rather than directly observed. Those filled regions cannot reveal previously unknown stars or galaxies, according to the project’s own warnings.
Other limitations deserve equal prominence: the detailed technical paper is still in preparation, downloadable map files have not yet been posted, and the work has not undergone human peer review. “Complete” describes the map’s coverage, not a complete set of telescope observations.
In an account published by Anthropic on October 8, 2026, astrophysicist Brice Ménard describes using Claude Science to assemble what the team calls the first complete ultraviolet map of the sky. Ménard works at Johns Hopkins University and is also an Anthropic researcher, making this a company-published account of a collaborator’s work, not an independent evaluation.
The result nevertheless offers a concrete example of AI-assisted scientific production. Claude Science agents reportedly found public datasets, calibrated tens of thousands of observations, combined incompatible surveys, filled remaining gaps statistically, and revised the output under Ménard’s direction. The important distinction is between automating that work and collecting new astronomical evidence.
Claude Science Worked on Existing Telescope Data
Ultraviolet observations reveal structures that look different from their counterparts in visible light, including dust illuminated by surrounding stars. But assembling an all-sky view requires space-based observations because Earth’s atmosphere absorbs ultraviolet light.
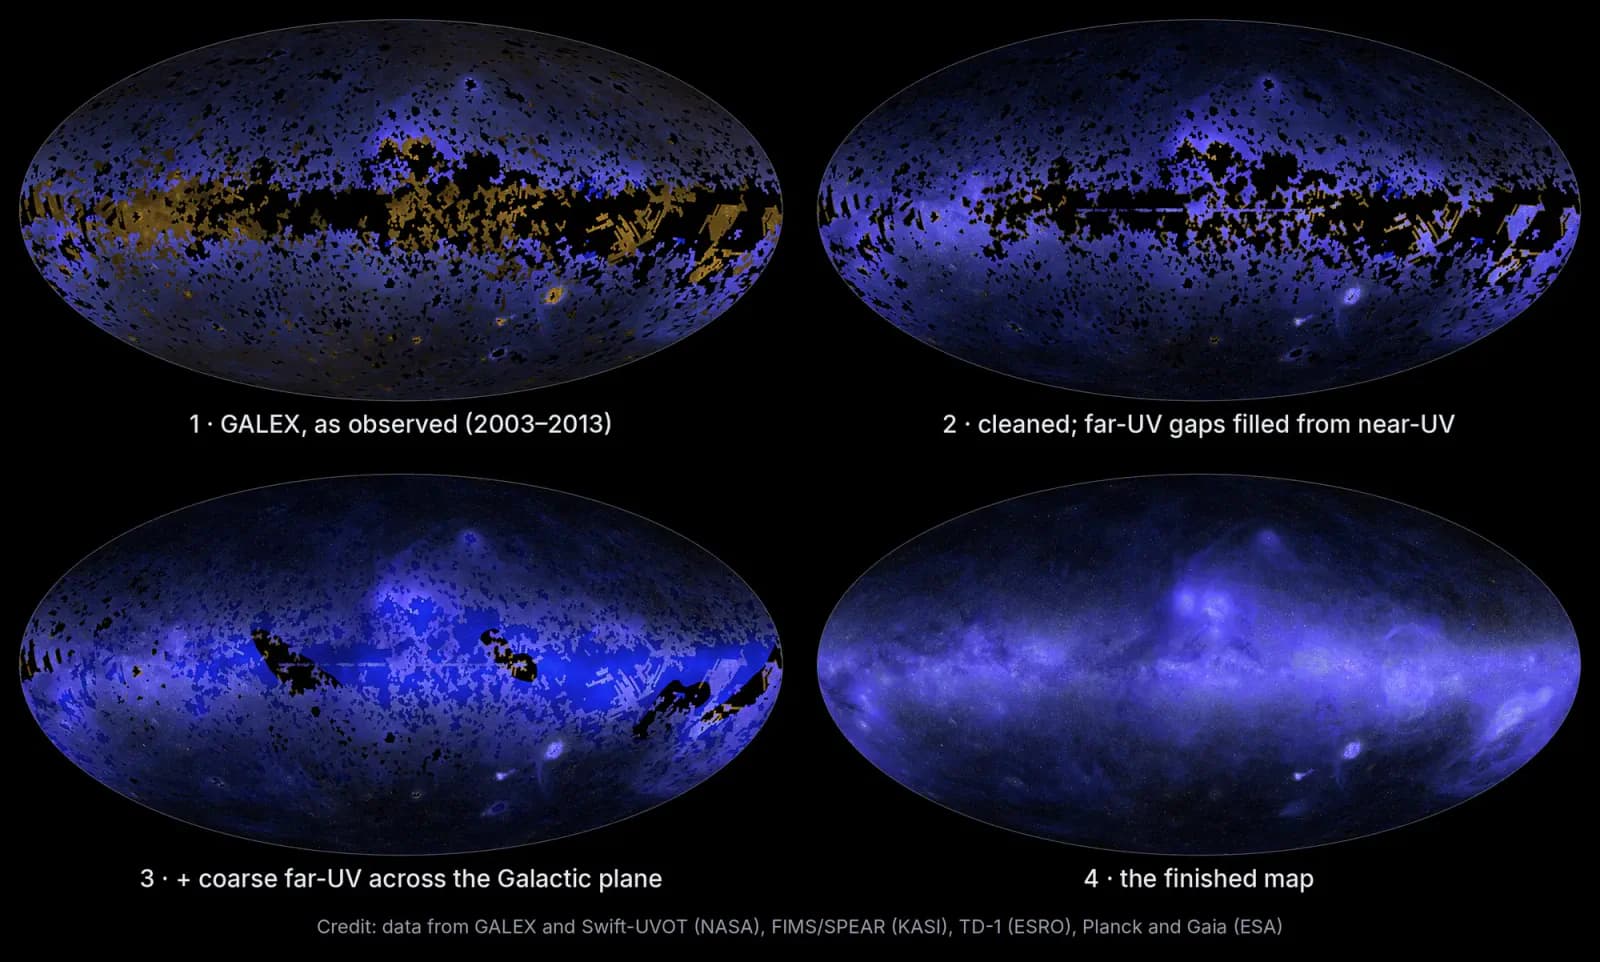
According to Ménard’s account, NASA’s GALEX mission supplied the largest dataset: approximately 38,000 observations covering about two-thirds of the sky. GALEX deliberately avoided some bright regions, including parts of the Milky Way’s plane, to protect its detectors. Other missions contributed observations without eliminating every gap.
The project combines GALEX, Swift-UVOT, FIMS/SPEAR, TD-1 and Gaia data. These inputs do different jobs: some provide ultraviolet measurements, while Gaia supplies visible-light information used to estimate the ultraviolet emission of known stars.
Claude Science’s first task was therefore data discovery and preparation. Ménard says its agents searched for publicly available surveys, downloaded the material and worked across different regions in parallel.
That is a useful application of agents, but it should not be confused with autonomous observation. The telescopes had already collected the evidence. Claude’s role was to organize and process it, with the scientific objective and high-level direction supplied by Ménard.
Calibration Was More Than Joining Images Together
Observations collected at different times do not automatically agree, even when they come from the same instrument. Background light, glare around bright stars and other observational effects can leave differences that become conspicuous when individual images are assembled into a larger map.
Ménard describes agents making each survey internally consistent before combining it with the others. Removing contamination around bright stars was especially important because that light can obscure the fainter ultraviolet emission the map aims to show.
Cross-survey fusion introduced another set of problems. Different instruments capture the ultraviolet sky differently, so their outputs needed cross-calibration, a common resolution and a shared coordinate system before merging.
These steps matter scientifically. A visible boundary between two survey images might reflect an instrument or processing difference rather than a real structure in space. Producing an attractive mosaic without resolving those differences could create misleading features.
The project says measured data takes priority, with predictions used only to fill remaining gaps. That preserves an important hierarchy: an available ultraviolet observation should not be replaced simply because a model can produce a smoother-looking estimate.
Still, “measured” does not mean untouched telescope output. Those pixels have passed through calibration and combination procedures. Their provenance distinguishes them from predictions, but the reliability of the processing remains part of the scientific assessment.
The Missing Third Comes From Statistical Relationships
Anthropic describes the gap-filling stage as “inpainting,” a term commonly used for reconstructing missing parts of images. Here, the important mechanism is a statistical regression using information from other wavelengths.
For regions with ultraviolet observations, the pipeline learned relationships between ultraviolet brightness and observations in visible, infrared and radio light. It then applied those relationships to locations where ultraviolet measurements were unavailable.
That approach constrains the predictions with real astronomical data. It is more informative than asking an image generator to draw a plausible-looking sky, but it still produces estimates rather than observations.
If an unusual ultraviolet source has no useful counterpart in the inputs, the regression has no direct ultraviolet evidence from which to recover it. This is why the project explicitly warns that filled regions cannot support the discovery of new stars or galaxies.
A separate stellar layer adds another distinction. Ménard says the pipeline estimated ultraviolet light from more than 100 million stars using Gaia’s visible-light measurements. These are known stars, but their inclusion does not establish that every star’s displayed ultraviolet emission was measured by an ultraviolet telescope.
For readers, the essential question is therefore not simply whether something appears on the map. It is which survey or prediction produced that part of the display.
The public map provides pixel-level provenance and uncertainty estimates to help answer that question. Those layers are central to interpreting the artifact responsibly, particularly where an apparently continuous structure crosses from observed sky into predicted sky.
Validation Tests Estimates, Not the Unobserved Sky
To assess the predictions, Ménard says he asked Claude to hide regions where ultraviolet measurements already existed. The pipeline then reconstructed those regions without access to the withheld ultraviolet values, allowing its output to be compared with actual observations.
Anthropic’s account reports that, after refinement, predictions came within about 10% of the real measurements. The project site reports roughly 12–14% prediction errors for filled sky in spatially held-out testing.
Those figures should not be compressed into a single claim that the entire map is “90% accurate.” The available summaries do not establish that they describe identical evaluation settings or calculations. The detailed technical paper will be needed to understand how the reported results relate.
Spatially held-out testing is relevant because it tests prediction across excluded regions, rather than merely checking whether a model can reproduce examples closely connected to its training data. But no test on observed sky directly measures the error in a region that has never been observed.
The reason for missing data also matters. GALEX avoided bright areas, including parts of the galactic plane. Those locations may differ from the regions supplying much of the training evidence, so successful reconstruction elsewhere does not automatically establish equal performance inside every gap.
Uncertainty estimates help communicate this limitation. They do not turn predictions into measurements, and a modest aggregate error does not establish that every faint feature or compact source is reliable. Educational visualization and object discovery demand different kinds of evidence.
Two Agent Reviews Missed an Error a Human Caught
The clearest account of the workflow’s limits concerns a defect that survived automated review.
Ménard noticed faint circular patterns in some dim fields. They corresponded to the footprints of individual GALEX observations, which contain a small, uneven ultraviolet glow from Earth’s atmosphere. Incomplete removal of that glow left neighboring observations slightly brighter or darker than one another.
Sources
- ultraviolet sky mapanthropic.com