Google Opens SatWeave and PARDIG Weather Data | Zeniteq
Loading
Zeniteq is now available on mobile for iPhone, iPad and Apple Watch.Download nowLearn more
Google Opens SatWeave and PARDIG Weather Data
Google DeepMind’s release gives developers satellite mosaics, precipitation estimates and historical archives, with important differences in update timing and coverage.
Google DeepMind released historical archives and live feeds for its SatWeave and PARDIG weather datasets on November 13, 2026, enabling external access for climate and hydrological applications. These datasets, which underpin the WeatherNext 3 model, are available via Google Cloud Storage and Earth Engine.
SatWeave provides harmonized satellite imagery with hourly updates, while PARDIG offers AI-estimated precipitation on a 0.1° grid. PARDIG-NRT updates in six-hour batches, while PARDIG-LR provides historical records dating back to 1999. Google claims PARDIG improves precipitation detection by over 30% versus IMERG-Final.
Google DeepMind opened the historical archives and live feeds for SatWeave and PARDIG on November 13, 2026, making two datasets behind WeatherNext 3 available for outside weather, hydrology, climate and Earth-observation applications. SatWeave supplies harmonized satellite imagery; PARDIG supplies AI-estimated precipitation. This is a dataset-access release, not a new WeatherNext model announcement. Both are available through Google Cloud Storage, with PARDIG historical catalogs also accessible through Google Earth Engine. (Announcement)
The most consequential detail is the difference between observation frequency and delivery speed. SatWeave’s operational mosaics arrive hourly with roughly one hour of latency. PARDIG describes rainfall every 15 minutes, but its live output arrives in six-hour batches, with individual estimates roughly two to eight hours old when published.
That distinction determines whether a feed fits a cloud-monitoring dashboard, a basin model or a time-sensitive warning system. The documentation also calls PARDIG experimental, so access to an operational feed should not be treated as a blanket guarantee of production suitability. (SatWeave guide, PARDIG guide)
SatWeave Turns Satellite Imagery Into a Shared Grid
SatWeave handles an awkward part of satellite-data engineering: combining observations delivered in different projections, formats, calibrations and scanning schedules. Google says it reprojects, cross-calibrates and blends those observations into a common latitude-longitude grid.
The result contains 17 spectral bands, covering reflected sunlight, atmospheric water vapor and thermal infrared observations. Developers can work with a harmonized dataset without first building separate ingestion pipelines for each satellite operator. (SatWeave documentation)
SatWeave property
Documented specification
Grid
0.1°, roughly 10 km; 1,801 × 3,600 cells
Dimensions
Time, latitude, longitude
Reflectance bands
Seven visible, near-infrared and shortwave-infrared bands, in percent
Ten shortwave, water-vapor and thermal-infrared brightness-temperature bands, in kelvin
Historical archive
2016–2025, at 30-minute intervals
Operational archive and feed
January 2026 onward, at hourly intervals
Live latency
Approximately one hour
Storage format
Zarr v3 on Google Cloud Storage
The technical guide describes five operational geostationary positions: GOES-East, GOES-West, Meteosat Prime at 0°, Meteosat Indian Ocean and Himawari. The announcement’s caption refers to six satellites without explaining the difference in count. For integration, the guide’s position and band-coverage tables provide the more useful detail. (Technical guide, announcement)
A Global Grid Does Not Mean Every Band Covers Everywhere
SatWeave’s grid extends from pole to pole, but the guide places actual geostationary sensor coverage at approximately 60°–65° north and south. Individual bands also have different geographic availability: the 509-nanometer green band comes only from Himawari, while the 1,370-nanometer cirrus band comes from GOES-East and GOES-West.
Visible and reflected-light channels serve daytime applications; thermal-infrared and water-vapor channels support day-and-night monitoring. A model expecting 17 equally available inputs everywhere would therefore make a poor assumption. Band availability and coverage need to be part of preprocessing. (Band specifications)
The historical cadence deserves equal attention. Training sequences sampled every 30 minutes in 2016–2025 will differ from the hourly sequences available operationally from 2026. I’d align the training cadence with the intended live deployment before interpreting an offline result as evidence of operational performance.
PARDIG Has Two Variants With Different Inputs
PARDIG, short for Precipitation AI Reanalysis: Densely Inferred GPM, estimates precipitation from satellite observations and ECMWF atmospheric fields. Google trained it against precipitation retrievals from the Combined Radar-Radiometer Algorithm, or CORRA, associated with the NASA/JAXA Global Precipitation Measurement Core Observatory.
Both released variants provide estimates every 15 minutes on a 0.1° grid. Their historical coverage, inputs and operational roles differ substantially. (PARDIG documentation)
Property
PARDIG-NRT
PARDIG-LR
Intended role
Near-real-time use and recent historical analysis
Long-record historical analysis
Coverage
January 2016 to present
January 1999 through December 2023
Temporal resolution
15 minutes
15 minutes
Atmospheric inputs
ECMWF HRES at 0.1°
ECMWF ERA5 at 0.25°
Satellite inputs
SatWeave, using 11 channels
NOAA GridSat-B1 and polar-orbiting passive microwave sounders
Cloud Storage updates
Every six hours
Static archive
Effective live latency
Approximately 2–8 hours
Not applicable
Google recommends PARDIG-NRT for operational use and analyses beginning in 2016 or later, including the years when both variants overlap. PARDIG-LR supplies the earlier record needed to reach back to 1999. (Variant guidance)
The combined availability spans 1999 to the present, but that does not make the two variants one uniform observational record. Their atmospheric and satellite inputs differ. A climate or drought study that joins them should account for those differences and historical observing-system transitions before interpreting a change in rainfall statistics as an environmental trend.
Why a 15-Minute Product Arrives Every Six Hours
PARDIG-NRT follows ECMWF HRES analysis cycles at 00, 06, 12 and 18 UTC. Once the required atmospheric fields and surrounding SatWeave mosaics are available, it generates six consecutive hours of precipitation estimates: 24 frames in one batch.
At publication, the newest frame is roughly two hours old, while the earliest is about 7.5–8 hours old. Average latency is approximately five hours. The 15-minute spacing describes the estimated weather history inside the batch, not a promise that fresh data will appear every quarter hour. (Publication schedule)
That makes PARDIG potentially useful for updating catchment conditions, reconstructing storms and running delayed hydrological analyses. For a fast-rising flood where minutes matter, I would not treat it as a substitute for an available low-latency local radar or gauge feed. The documented delivery delay is the reason for that caution.
Where to Access the Data
Google’s developer guides provide the access links and variable documentation. Both datasets carry a CC BY 4.0 license, and the guides describe access through any Google Cloud account without an access-request form.
The practical entry points are:
SatWeave: Google Cloud Storage at gs://satweave_1/. The guide distinguishes the 2016_to_2025/ historical collection from the 2026_to_present/ operational collection.
PARDIG-NRT live data:gs://pardig_1/NRT/zarr/2026_to_present/. The PARDIG guide also links to the historical NRT and LR collections.
PARDIG in Earth Engine: Historical catalogs for both variants. At launch, the NRT catalog covers January 2016 through October 2026; LR covers 1999–2023.
The SatWeave guide and PARDIG guide are the supported starting points for those storage and catalog links.
Earth Engine is not the live PARDIG delivery surface. Its NRT collection is a static historical archive, while Cloud Storage carries the continuously updated operational stream. A historical notebook and a live service therefore need different access choices.
SatWeave uses Zarr v3; PARDIG is also distributed as Zarr. Developers should check their reader’s format support before planning an ingestion pipeline, particularly for SatWeave’s explicitly documented version.
Preserve the Meaning of Precipitation Values
PARDIG’s precipitation variable is a 32-bit floating-point instantaneous rate in meters per hour, not a rainfall accumulation for the preceding 15 minutes. That distinction can create large errors in downstream hydrology if it is missed. (Variable definition)
Two conversions illustrate the issue:
A value of 0.001 m/h equals 1 mm/h.
If that rate were constant for 15 minutes, the resulting accumulation would be 0.25 mm.
The second calculation assumes the rate remains constant between samples. An hourly or daily rainfall total requires a stated integration method; simply summing stored rates does not produce an accumulation.
Spatial resolution imposes another practical boundary. A roughly 10 km precipitation grid can provide useful regional forcing, but it cannot resolve street-level rainfall detail by itself. Flood applications still need appropriate terrain, drainage, routing and local validation.
Match Each Dataset to the Application
SatWeave’s clearest immediate value is consistent access to cloud and atmospheric observations. Google identifies solar forecasting and wildfire monitoring as potential applications. Its documentation links visible channels to daytime cloud structure and solar-insolation work, while infrared channels support cloud-temperature and hot-spot analysis. Those are useful inputs, not complete solar or wildfire prediction systems. (SatWeave guide)
PARDIG supplies a different building block: estimated precipitation for flood, landslide and drought modeling, including places without dense ground-radar networks. Recent operational work points toward NRT; studies needing the 1990s point toward LR, with attention to record consistency. (Announcement)
The strongest practical benefit is reduced upstream preparation. A developer can start with harmonized imagery or gridded precipitation estimates and focus on the downstream model. The remaining work shifts toward coverage handling, timing, unit conversion and local validation.
What Google’s Accuracy Comparison Shows
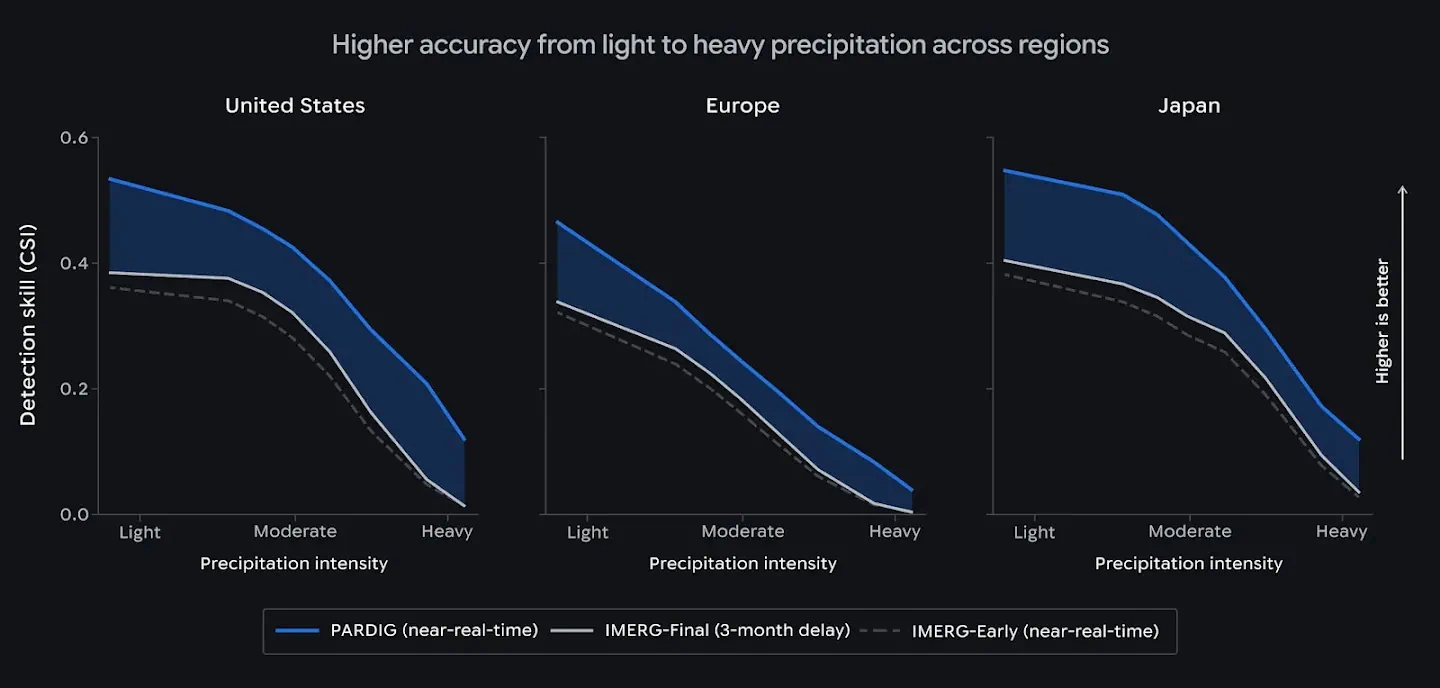
Google reports that PARDIG improves hourly precipitation detection skill over NASA’s IMERG-Final by more than 30% for light-to-moderate precipitation. Its announcement describes evaluations against radar networks in the United States, Europe and Japan, plus more than 36,000 weather stations worldwide. The accompanying radar comparison covers 2016–2023 and uses Critical Success Index across rainfall-intensity thresholds. (Evaluation summary)
That is a claim about a particular detection metric, not a statement that every rainfall amount is 30% more accurate. These are Google-reported results; the cited sources do not provide an independent reproduction. The company also expresses an expectation of reliable performance in regions lacking ground measurements, which deserves separate local evaluation.
For deployment, the useful test is specific: whether the product captures the rainfall thresholds, accumulation periods and events that matter in the intended region, soon enough for the application to act.
Frequently Asked Questions
3 questions
1
Where Can I Access SatWeave and PARDIG?
Both are on Google Cloud Storage. Start with the SatWeave and PARDIG developer guides for access links. PARDIG’s historical catalogs are also available in Earth Engine.
2
Which PARDIG Variant Should I Choose?
Use NRT for live data or studies starting in 2016 onward. Use LR when you need the 1999–2023 historical record, accounting for its different inputs when combining variants.
3
Can I Use the Datasets Commercially?
Yes. Both guides specify CC BY 4.0, which permits commercial reuse with attribution under the license’s terms. Public access requires no dataset access-request form.