
A fresh claude.ai page became typeable in 550 milliseconds at the 75th percentile, down from 3,085 milliseconds two weeks earlier. That 5.6x improvement was one result of Anthropic’s AI-assisted performance sprint, according to its engineering account.
The broader “3x faster” claim covers improvements across 13 measurements of the website and desktop app. It does not mean Claude’s underlying model generates answers three times faster.
For developers, the useful part is the workflow. Claude investigated bottlenecks, built benchmarks, changed code, and monitored deployments through a Slack-based process. Engineers supplied the goals, judged tradeoffs, and approved every change. They also had to ensure that a better benchmark score reflected a better product.
Where Claude.ai Became Faster
Anthropic focused on four journeys it says accounted for 95% of user activity: launching the app, starting a conversation, loading an existing conversation, and sending a message.
These selected results compare real-user monitoring from August 13 and August 27, 2026. All timings are at the 75th percentile, meaning 75% of measured interactions completed within the reported duration.
| Interaction | Before | After | Speedup |
|---|---|---|---|
| Fresh claude.ai web load, time to typeable page | 3,085 ms | 550 ms | 5.6x |
| Desktop app cold start | 6,310 ms | 3,328 ms | 1.9x |
| Start a web chat | 416 ms | 273 ms | 1.5x |
| Start a Claude Code desktop session | 837 ms | 347 ms | 2.4x |
| Load an existing web chat | 1,557 ms | 646 ms | 2.4x |
| Load a Claude Cowork cloud session on desktop | 2,566 ms | 728 ms | 3.5x |
| Send a Claude Cowork cloud message on desktop, client-side portion | 928 ms | 48 ms | 19x |
The final row measures only client-side work, not the time needed to generate a response. Likewise, becoming typeable does not mean every part of the application has finished initializing.
Across all 13 measurements, Anthropic reports a 3.1x geometric-mean speedup. That aggregate does not describe every action or individual user’s experience. The company also estimates that the improvements save tens of thousands of user-hours daily, a calculation that depends on traffic volumes as well as latency reductions.
Define the User Journey Before Changing Code
The sprint began with a standing instruction in a Slack channel:
@Claude Your job is to facilitate all things related to the performance of the claude.ai website and desktop app.
The accompanying responsibilities covered telemetry, dashboards, regression monitoring, implementation, and communication. Anthropic says Claude analyzed usage through the Datadog MCP server to identify the highest-impact journeys.
Engineers added instrumentation that began each measurement with a user interaction and ended it when the result rendered. It also distinguished client work from server work, giving the team a defined target for “faster.”
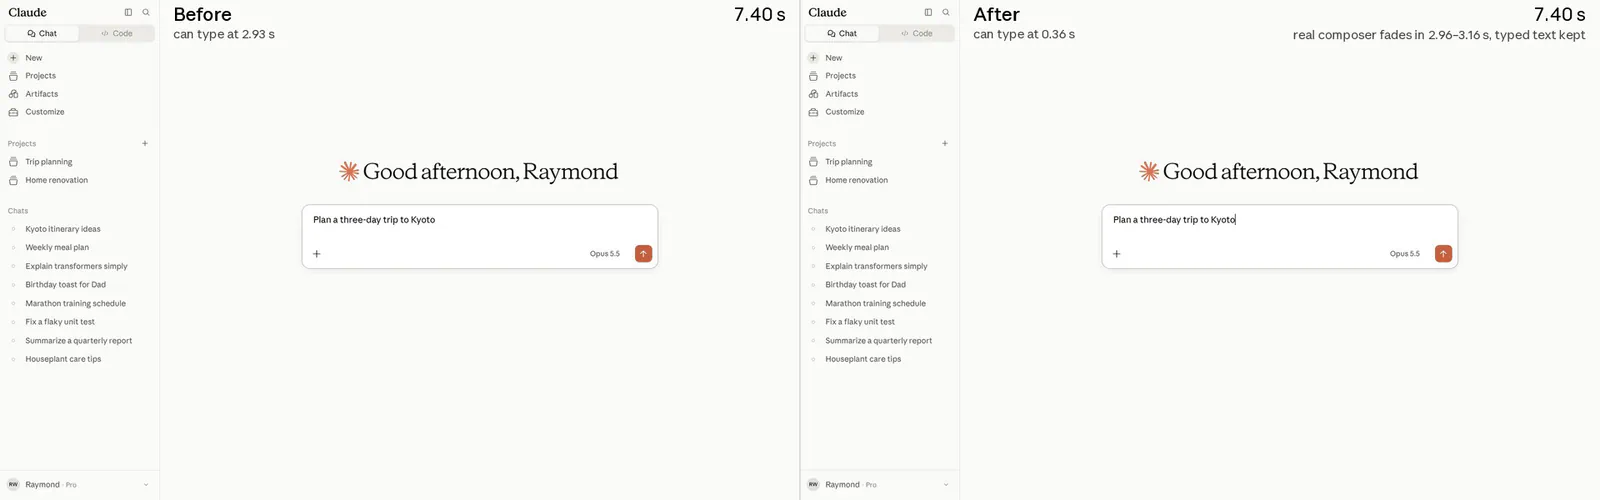
The initial plan contained about 20 projects, with Claude estimating their impact in milliseconds. Anthropic says the team reached 12 of its 13 original targets by day three, then raised its ambitions.
Early changes addressed specific sources of waiting:
- A static composer in the HTML let users type during React initialization.
- A precompiled V8 code cache avoided recompiling the desktop shell’s main process from scratch.
- Keeping the composer mounted between conversations avoided unnecessary reconstruction.
- Prefetching sessions on hover moved loading work ahead of navigation.
Prefetching illustrates the tradeoffs engineers still had to judge. It can move work earlier without eliminating it; the question is whether that improves the chosen interaction enough to justify the change.
Give Claude a Repeatable Metric to Improve
Production latency was the outcome, but waiting for deployment data after every edit would have slowed experimentation. Wall-clock measurements also fluctuate, making small improvements difficult to distinguish from noise.
Anthropic explored more repeatable lab measurements:
- CPU instruction counts for JavaScript hot paths under Valgrind with
node --predictable. - React commits per interaction.
- Function-call counts from V8’s precise coverage.
- Style recalculations and DOM mutations.
These counters gave Claude concrete optimization targets, though they were not automatically trustworthy substitutes for elapsed time. One published instruction made the validation requirement explicit:
@Claude please prove that hill climbing against each of these can result in measurable wall clock perf wins.
Here, hill climbing means repeatedly changing an implementation to improve a defined score. A score that does not track the user’s experience can lead that work astray.
Anthropic tested the relationship on two hot paths. In message-tree assembly, Claude found repeated lookups resolving the same message ID three times. Resolving it once reduced instruction counts by 48% and benchmark wall-clock time by 78%.
For a status-line scanner, a cheap first-character check before a regular expression reduced instructions by 31% and elapsed time by 44%.
Instruction counts came from Valgrind with predictable Node execution; timings came from ordinary Node with a warm just-in-time compiler. These were two microbenchmarks, not application-wide speedups or proof that instruction reductions always translate proportionally into lower latency.
Anthropic discarded benchmarks that were flaky or failed to correlate with user latency. That rejection rule kept the optimization loop tied to the intended outcome.
Turn Each Slack Thread Into a Bounded Experiment
Slack organized the work. Within each investigation, the method followed a sequence:
- Identify a slow interaction. Define the action and the visible result that completes it.
- Find the expensive path. Trace the work and establish a representative benchmark.
- Validate the metric. Show that improving the lab measurement also reduces elapsed time.
- Change and review the code. Preserve expected behavior while removing unnecessary work.
- Check production results. Verify that the improvement survives outside the lab.
For the two validated instruction-count benchmarks, Anthropic established CI ceilings that rejected regressions. A daily job lowered those ceilings when counts improved. This created a performance ratchet: successful optimization tightened the future acceptance threshold.
The workload still had to remain meaningful. Removing representative inputs or weakening an assertion could improve a score without improving the application. Changes to a benchmark therefore deserve scrutiny comparable to changes in the code it measures.
Parallel Work Still Needed Human Control
Anthropic reports opening five measurement threads within eleven minutes as it expanded into instruction counts, function calls, React commits, style recalculations, and DOM mutations. Independent experiments let the team investigate several possible bottlenecks without forcing every task through one serial conversation.
The company says the complete sprint merged more than 3,000 changes without a customer-facing incident or rollback. Those are company-reported outcomes, not an independently established guarantee about AI-generated code.
The model configuration also limits generalization. Anthropic used Claude Tag, in beta, with an internal research model it described as roughly comparable to Opus 5.5. The sprint should not be treated as a benchmark of a standard Claude Code setup.
For teams adapting the workflow, performance tests must sit alongside functional checks, automated review, visual regression tests, and controlled deployment. Short-lived feature flags and staged rollouts provide ways to limit exposure while gathering field evidence.
A counter cannot decide whether removing a visual element is acceptable or whether aggressive prefetching creates an unwanted resource cost. Those remain product and engineering decisions, even when an agent can implement the alternatives quickly.
A Performance Prompt Developers Can Adapt
The published account includes standing instructions and follow-up prompts, but those excerpts are not a complete specification of Anthropic’s internal tooling.
A separate Claude Code prompting guide recommends defining what completion looks like and when the agent must stop for approval. Applied to performance work, that suggests a bounded investigation instead of an open-ended request to “make everything faster.”
The following prompt is an adaptation of the method, not Anthropic’s verbatim sprint prompt:
Investigate and optimize [interaction] in [repository].

Define the measured path from user action to visible result.
Record baseline latency on a fixed, representative workload.
Propose a repeatable lab metric and demonstrate that it tracks
elapsed time.

Make one focused change. Report before/after measurements,
functional test results, and any behavior or visual differences.
Deliver a reviewable PR with a feature flag, rollout plan,
and rollback procedure.

Do not deploy, raise CI limits, weaken tests, or change the
benchmark workload without approval. Mark anything you could
not verify.

After an approved rollout, compare real-user results before
recommending a tighter CI ceiling.
The prompt requires corresponding access and infrastructure: repository tools, representative workloads, telemetry, and a review process. Instructions alone cannot establish that an optimization worked.
Before opening dozens of parallel investigations, establish one complete path from a lab improvement to a verified production result. Parallelism can multiply that process, but it cannot establish that the original metric was worth optimizing.
Frequently Asked Questions
3 questions
1Did Claude’s AI responses become three times faster?
No. Anthropic’s 3.1x figure is the geometric mean of improvements across 13 application-performance measurements. Those cover actions such as opening the app, loading conversations, and the client-side portion of sending messages. The report does not establish a threefold improvement in model inference or answer-generation speed.
2Can developers reproduce this workflow with Claude Code?
The method can be adapted to Claude Code, but Anthropic’s sprint used Claude Tag with an internal research model. Applying the process requires repository access, trustworthy benchmarks, telemetry, review, and deployment controls. The example prompt describes an engineering workflow, not a guarantee that another model or codebase will achieve the same speedup.
3Which metrics should an AI performance agent optimize?
Use user-facing elapsed time as the outcome, with validated lab counters providing faster feedback. Anthropic explored CPU instruction counts, React commits, function calls, style recalculations, and DOM mutations. A counter is useful only when reducing it also improves the relevant interaction without breaking behavior or changing the benchmark workload.
Sources
- engineering accountclaude.dev
- Claude Code prompting guideclaude.dev